Issue Date: Wednesday, July 18th, 2018
Issue Time: 9:30 AM MDT
Summary:
As an upper-level low shifted over the Northern Rockies, a few disturbances were sent Colorado’s way, leading to a day full of scattered showers/thunderstorms. Plenty of low-level moisture was available to storm development, resulting in efficient rainfall production, as well as increased instability that led to more intense thunderstorms (relatively speaking) than recent days. A couple storms were able to reach severe thresholds, with the following observations being reported to the National Weather Service:
70 mph wind gust: Grand Junction Regional Airport (Mesa County)
60 mph wind gust: 3 miles ENE of Redlands (Mesa County)
59 mph Wind Gust: Eagle County Regional Airport (Eagle County)
Sub-severe hail (0.25 inch diameter) was also reported in Montezuma County
Heavy rainfall was a concern with the amount of moisture available, and thunderstorms were able to produce plenty of it. A trained NWS spotter reported 0.7 inches/20 minutes 4 miles N of Florissant (Teller County). Flash flooding was reported 3 miles SW of Dolores (Montezuma County), where flooding occurred along Highway 184. A few debris flow observations were also reported:
1 mile ENE of Trimble (La Plata County): US 550 was closed at mile marker 30-31 due to mud flow
8 miles W of Chimney Rock (Archuleta County): Mudflow closed Highway 160 at mile marker 121-124. Cars were stuck in deep mud. Additionally, rocks were reported on the road near mile marker 123.
9 miles WSW of Chimney Rock (Archuleta County): Mud and debris on Highway 151 at mile marker 28
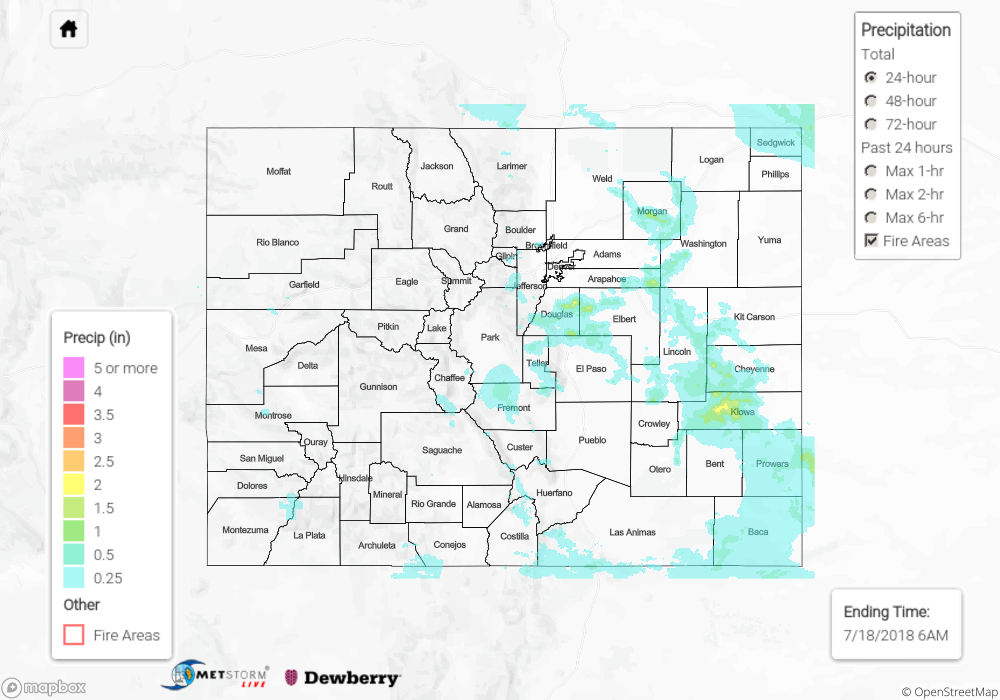
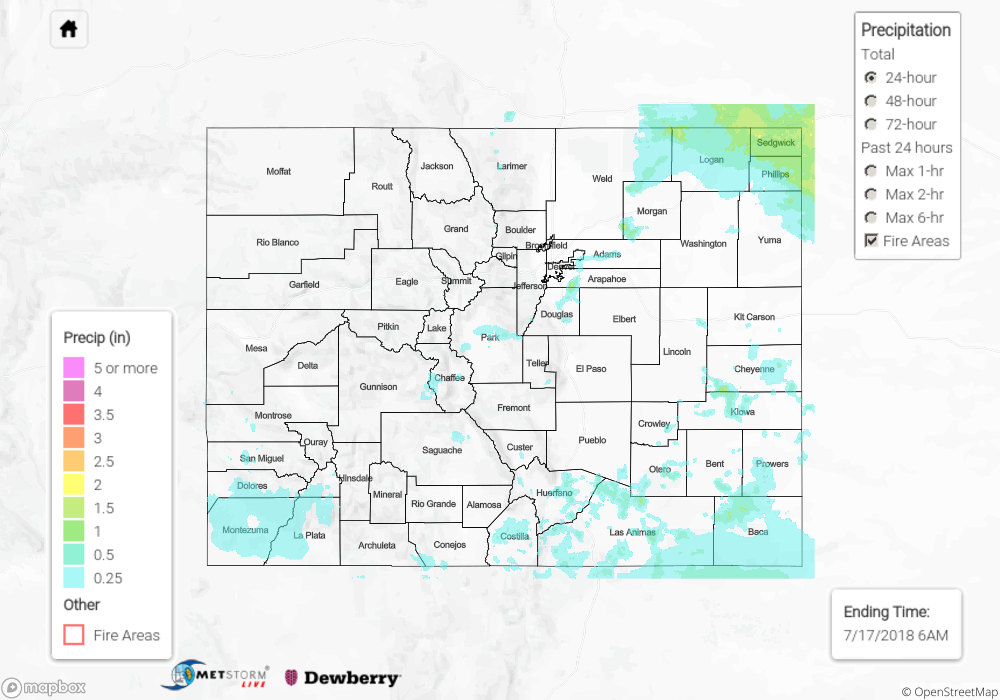
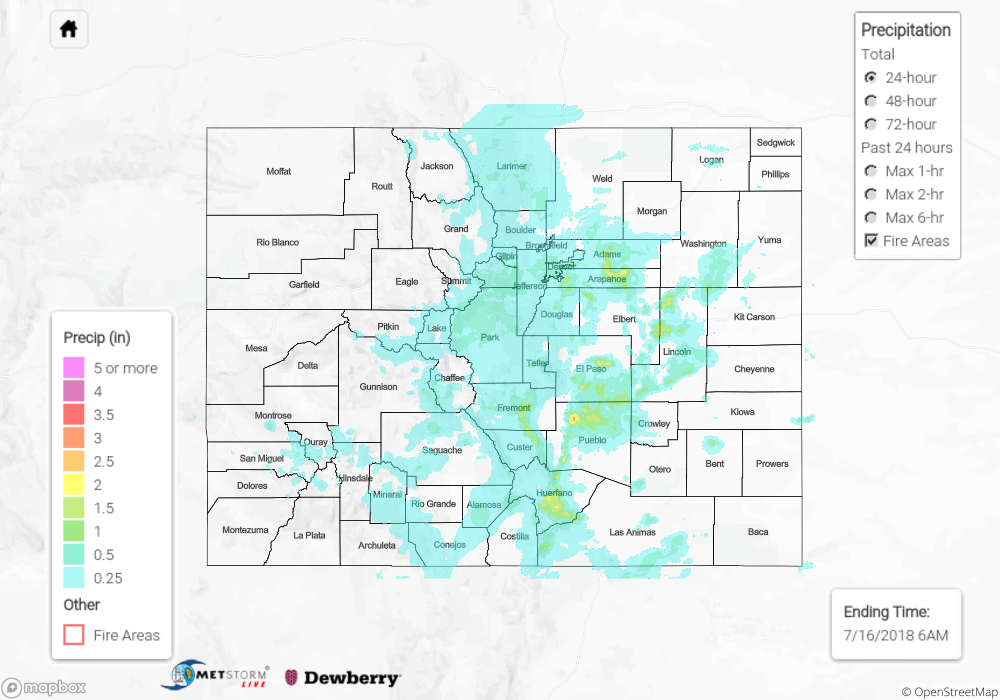
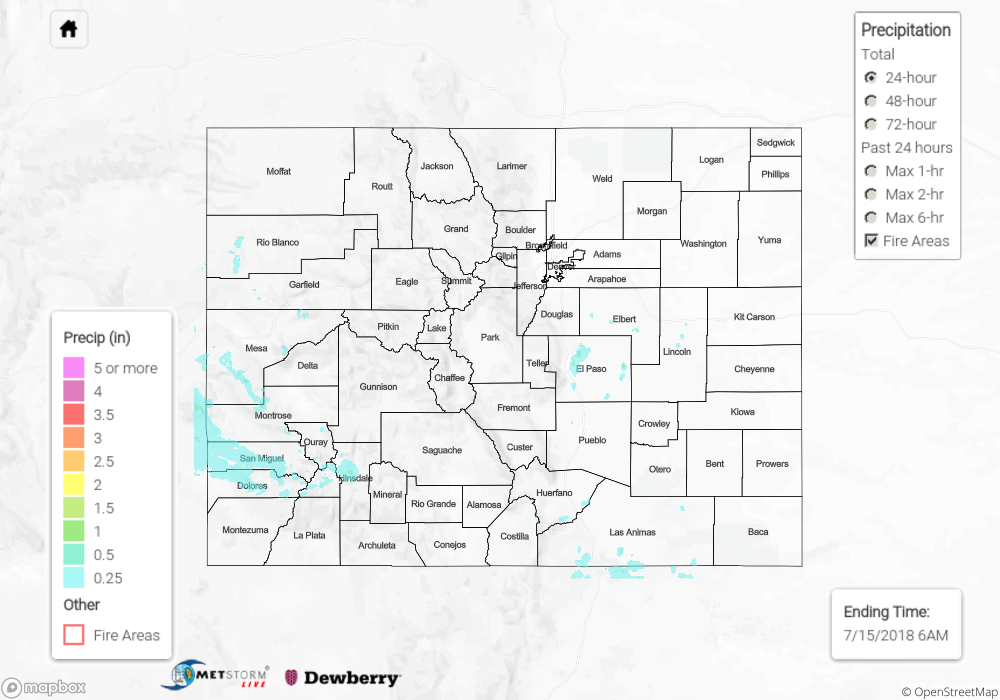
For a look at precipitation estimates in your area, please see our State Precipitation Map below.
Click Here For Map Overview
The map below shows radar-estimated, rainfall gage-adjusted Quantitative Precipitation Estimates (QPE) across Colorado. The map is updated daily during the operational season (May 1 – Sep 30) by 11AM. The following six layers are currently available: 24-hour, 48-hour and 72-hour total precipitation, as well as maximum 1-hour, 2-hour and 6-hour precipitation over the past 24 hour period (to estimate where flash flooding may have occurred). The 24-hour, 48-hour and 72-hour total precipitation contain bias corrections that are not disaggregated into the hourly estimates, so there will likely be some differences. The accumulation ending time is 6AM of the date shown in the bottom right corner. Also shown optionally are fire burn areas (post 2012), which are updated throughout the season to include new burn areas. The home button in the top left corner resets the map to the original zoom.