Issue Date: Tuesday, July 17th, 2018
Issue Time: 10:00 AM MDT
Summary:
Drier air moved into northern Colorado, which limited thunderstorm development over the Front Range, Northern Mountains and Central Mountains yesterday. Subtropical moisture was better able to hold on over the Southeast Mountains, Raton Ridge and San Juan Mountains. Thus, afternoon upslope flow driven thunderstorms were more abundant further south. These storms moved into the eastern plains and brought some much needed rainfall to Las Animas and Baca County in the evening hours. Overnight, an MCS that moved through the NE panhandle and clipped the northeast corner of the state, which brought some heavy rainfall to Sedgwick and Phillips Counties.
As far as totals, the northeast corner of the state was the winner yesterday. A couple CoCoRaHS recorded over an inch of rainfall with radar estimates up to 2 inches. No flooding was reported as of this morning. Several flood advisories were issued yesterday including two for the 416 and Weston Pass burn scars. Thankfully, no mud flows or debris slides were reported. There was a heavy rain report over Cortez of 1.55 inches. This caused street flooding and some minor flooding of apartments. There were two CoCoRaHS reports greater than 1 inch in this area. SNOTEL stations in this area recorded rainfall between 0.9 and 1.5 inches. Over the Southeast Mountains, the Apishapa SNOTEL station near La Veta recorded 1.7 inches over the 24 hour period.
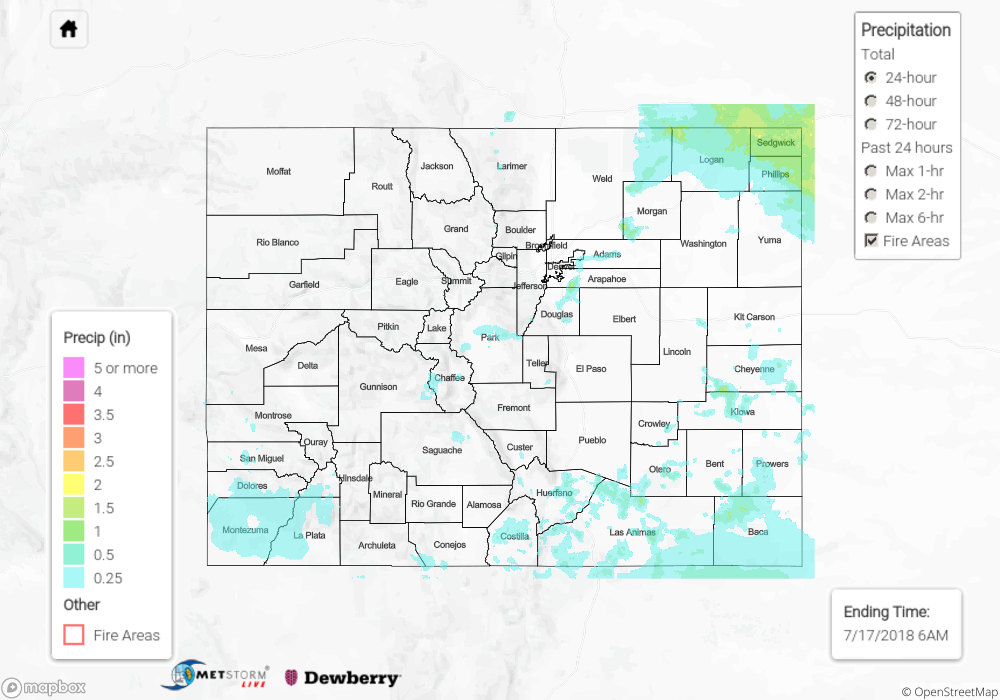
To see how much precipitation fell in your area, scroll down to the State Precipitation Map below.
Click Here For Map Overview