Issue Date: Monday, July 16, 2018
Issue Time: 10:00 AM MDT
Summary:
A lot of widespread and heavy rainfall on Sunday after the passage of a cold front help moisten the low-levels for afternoon upslope flow. Upper disturbances also increased coverage and intensity of showers and thunderstorms yesterday through this morning. The start to Sunday morning was quite cloudy with temperatures quite a few degrees cooler after the passage of the front. So rain kicked off around noon over the higher terrains and along a pre-frontal convergence boundary over the Urban Corridor/Palmer Ridge. With nearly no upper flow, the storms continued to pulse over the same area for a couple hours at a time. Throughout the day, the storm coverage increased and a few showers slowly moved off the mountains into the Urban Corridor.
Along the pre-frontal convergence area, rain fall estimates by radar were just over 2 inches with max 1-hour rain rates between 0.5-1.5 inches/hour. At E-470 and Highway 83, an ALERT gage recorded 2.05 inches. Most CoCoRaHS captured between 1.5 and 2.3 inches over this area and further south over El Paso County. The highest reported values yesterday was in Pueblo West where 2.62 inches fell over a 5 hour span. Flash flooding occurred near the Junkins burn scar between county roads 386 and 389. The highway remains closed through noon today. Other places along the Front Range saw a jump in river height between 1-3 feet, but no flooding occurred. Over the San Juan Mountains, there were mud flows in San Miguel County along Highway 145. Rainfall radar estimates were just over 0.5 inches. A couple SNOTEL stations in the area recorded 0.9 inches.
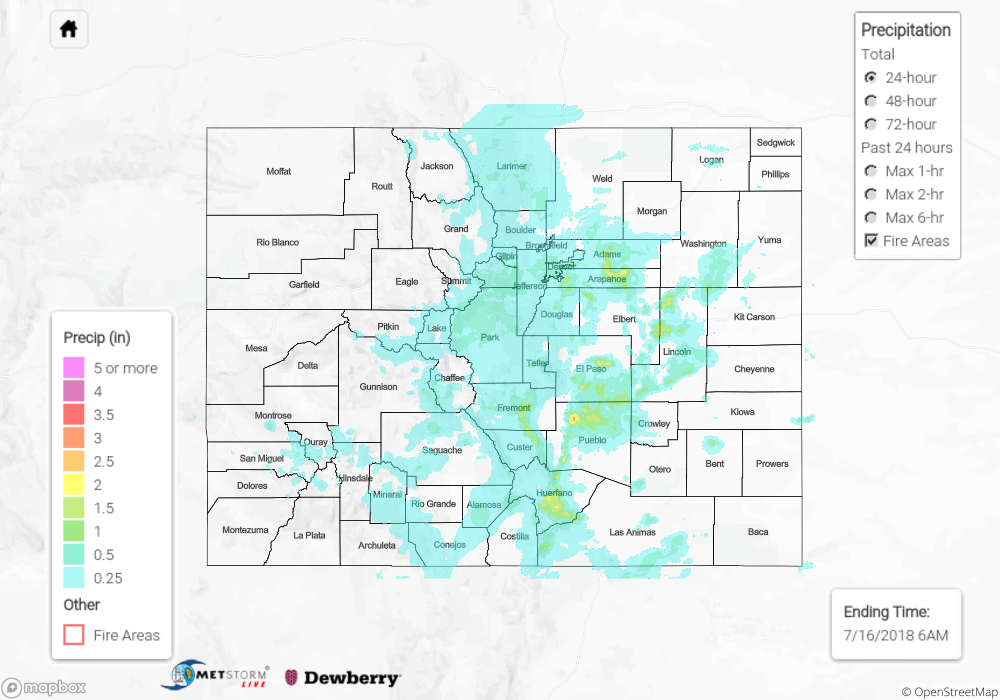
To see how much precipitation fell in your area, scroll down to the State Precipitation Map below.
Click Here For Map Overview