SPM 08-03-2018: Shortwave Triggered Plenty of Clouds, but Rainfall Totals were Limited

Issue Date: Friday, August 3rd, 2018
Issue Time: 09:45 AM MDT

Summary:

Another shortwave trough rounded the ridge and passed through the state on Thursday. Storms began to fire over the higher terrains in the mid-afternoon with the majority of the activity over western Colorado and the higher terrains. Without much instability from heavy cloud cover and haze, the weak thunderstorms and showers were pulse-like and short-lived. Showers continued overnight over the northwest corner of the state as the trough approached from the east and provided extra lift to keep the atmosphere active.

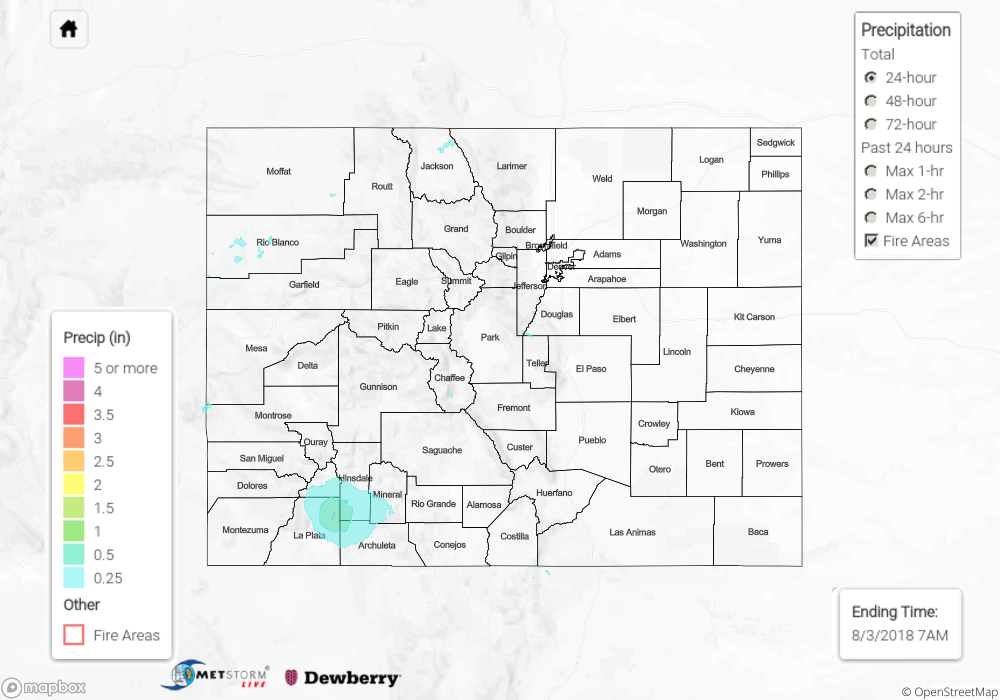
Most totals yesterday were just at or under 0.25 inches except over the southern San Juan Mountains. A CoCoRaHS station near Vallecito Lake reported 0.7 inches. The areal extent of the thunderstorms yesterday was not large, which helped limited excessive runoff and flash flooding potential over the burn scars. To the east, Alamosa recorded 0.08 inches. Over the eastern mountains, an Areal Flood Advisory was issued for the Junkins burn scar just after 7PM as a storm tracked directly over the burn scar. No flooding was reported as of this morning, and max 1-hour radar rainfall estimates were just under 0.25 inches.

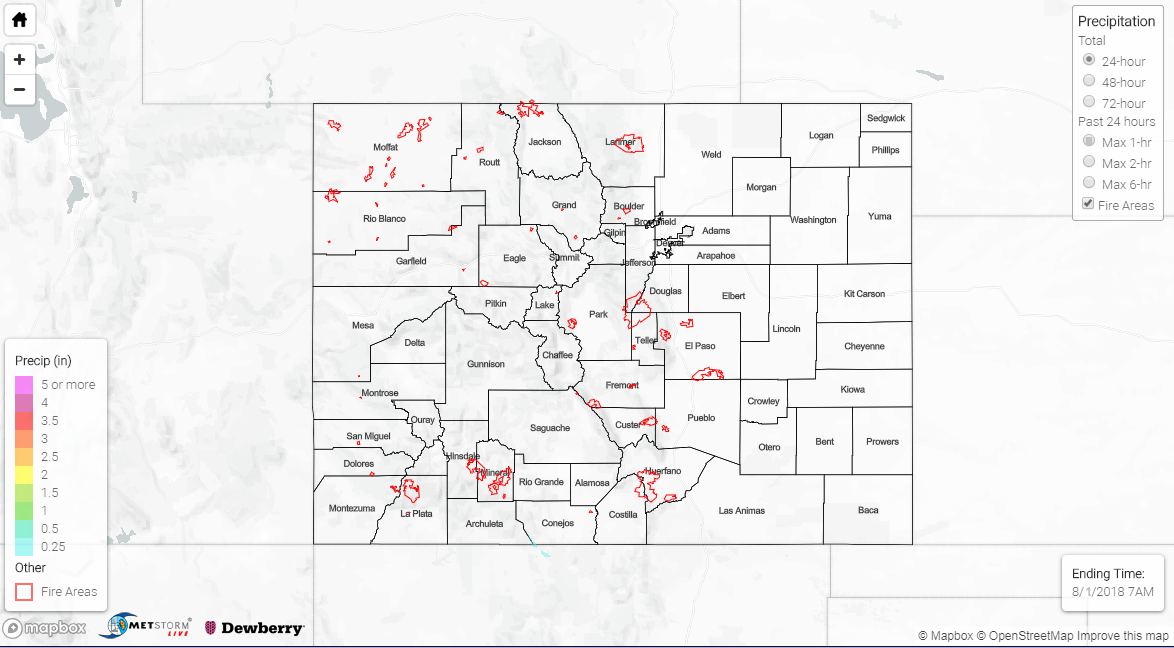
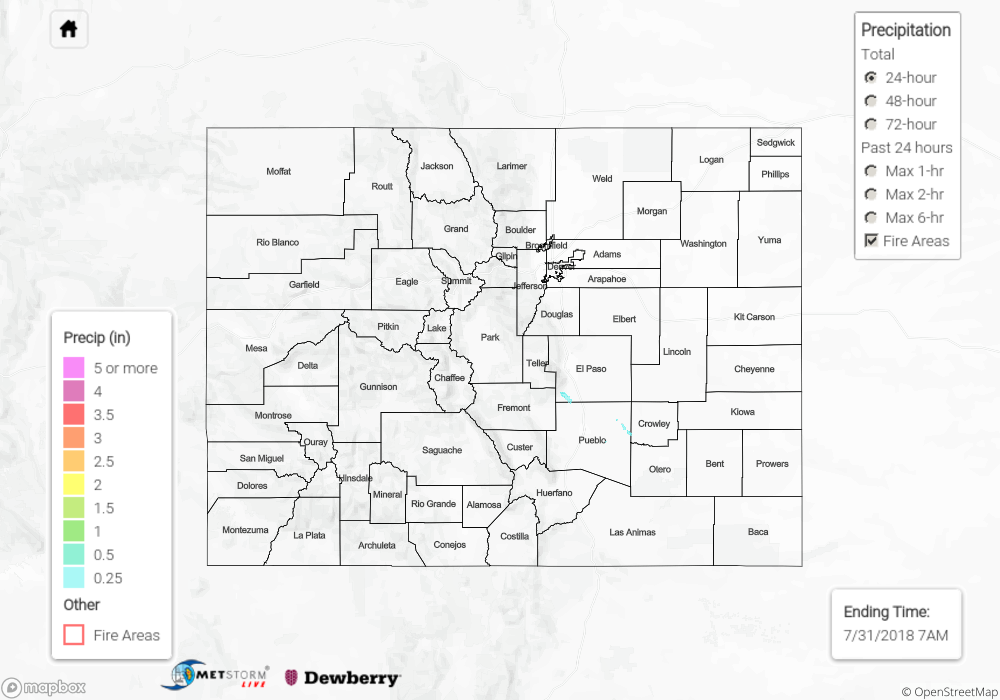
To see how much precipitation over your area the last 72-hours, scroll down to the State Precipitation Map below.

Click Here For Map Overview

The map below shows radar-estimated, rainfall gage-adjusted Quantitative Precipitation Estimates (QPE) across Colorado. The map is updated daily during the operational season (May 1 – Sep 30) by 11AM. The following six layers are currently available: 24-hour, 48-hour and 72-hour total precipitation, as well as maximum 1-hour, 2-hour and 6-hour precipitation over the past 24 hour period (to estimate where flash flooding may have occurred). The 24-hour, 48-hour and 72-hour total precipitation contain bias corrections that are not disaggregated into the hourly estimates, so there will likely be some differences. The accumulation ending time is 7AM of the date shown in the bottom right corner. Also shown optionally are fire burn areas (post 2012), which are updated throughout the season to include new burn areas. The home button in the top left corner resets the map to the original zoom.

SPM 08-02-2018: Passing Shortwave Increased Thunderstorm Activity over the Mountains and Adjacent Plains

Issue Date: Thursday, August 2nd, 2018
Issue Time: 09:35 AM MDT

Summary:

General increase in shower coverage during the afternoon hours thanks to a passing shortwave trough rounding the ridge. The shortwave started the morning over the northwest corner of the state, but without much instability and low-level moisture, cloud cover and virga were the main outcome. Throughout the day the shortwave traveled to the southeast and arrived to the Front Range and Southeast Mountains by mid-afternoon. Instability was greater over the southern mountains, Raton Ridge and Palmer Divide, so coverage of storms was greater over these area. Some weak thunderstorms were also able to form over the southern ridgelines of the San Juan Mountains.

For the most part, the lack of low-level moisture had the storms producing more gusty winds and dangerous lightning than wetting rainfalls. A CoCoRaHS near Arriba measured 0.6 inches with radar estimates up to 1 inch/hour. A USGS gage recorded just over 0.5 inches outside of Colorado Springs in the Black Forest. Small hail was also reported (0.88 inches) in the storm near Colorado City. 24-hour totals over the SNOTEL ranged from 0.1 – 0.3 inches over the Southeast and San Juan Mountains. Storm activity began to decrease from west to east after sundown. Lastly, a Flash Flood Warning was issued for the Spring Creek fire, but as of Thursday morning, there was no flooding reported.

To see how much precipitation over your area yesterday, scroll down to the State Precipitation Map below.

Click Here For Map Overview

The map below shows radar-estimated, rainfall gage-adjusted Quantitative Precipitation Estimates (QPE) across Colorado. The map is updated daily during the operational season (May 1 – Sep 30) by 11AM. The following six layers are currently available: 24-hour, 48-hour and 72-hour total precipitation, as well as maximum 1-hour, 2-hour and 6-hour precipitation over the past 24 hour period (to estimate where flash flooding may have occurred). The 24-hour, 48-hour and 72-hour total precipitation contain bias corrections that are not disaggregated into the hourly estimates, so there will likely be some differences. The accumulation ending time is 7AM of the date shown in the bottom right corner. Also shown optionally are fire burn areas (post 2012), which are updated throughout the season to include new burn areas. The home button in the top left corner resets the map to the original zoom.

SPM 08-01-2018: Rising Pressure Heights and Dry Air Suppress Afternoon Thunderstorm Activity

Issue Date: Wednesday, August 1st, 2018
Issue Time: 09:15 AM MDT

Summary:

Continued entrainment of dry air from the north and rising pressure heights suppressed shower and thunderstorm activity across the state on Tuesday. Below are the relative humidity values from yesterday at 4PM. Most regions are in the 20-30% range with stations over western Colorado in the single digits. Thankfully winds were weak, so there were lesser fire concerns. Some moisture was able to hang on over the far southern border, so there were a few showers and thunderstorms over the San Juan and southern tip of the Southeast Mountains during the afternoon. The Cumbres Trestle SNOTEL site in the area recorded 0.4 inches. As we start August, the drought continues to worsen over the Southeast Plains/Mountains and northwest corner of the state with only limited improvements over the Northern Mountains and Front Range. Here’s to hoping this next surge of monsoon moisture will help alleviate the dry soils, and at the same time, avoid recent burn scars.


To see how much precipitation over your neighborhood the last 72-hours, scroll down to the State Precipitation Map below.

Click Here For Map Overview

The map below shows radar-estimated, rainfall gage-adjusted Quantitative Precipitation Estimates (QPE) across Colorado. The map is updated daily during the operational season (May 1 – Sep 30) by 11AM. The following six layers are currently available: 24-hour, 48-hour and 72-hour total precipitation, as well as maximum 1-hour, 2-hour and 6-hour precipitation over the past 24 hour period (to estimate where flash flooding may have occurred). The 24-hour, 48-hour and 72-hour total precipitation contain bias corrections that are not disaggregated into the hourly estimates, so there will likely be some differences. The accumulation ending time is 7AM of the date shown in the bottom right corner. Also shown optionally are fire burn areas (post 2012), which are updated throughout the season to include new burn areas. The home button in the top left corner resets the map to the original zoom.

SPM 07-31-2018: Downtick in Shower and Thunderstorm Activity on Monday

Issue Date: Tuesday, July 31st, 2018
Issue Time: 09:00 AM MDT

Summary:

With the upper-level high parked over the desert southwest, northerly flow over the state pulled in very dry air from WY and MT. This limited the rainfall chances during the afternoon and evening hours with the exception of a few isolated storms over the Southeast Mountains, Raton Ridge and Palmer Ridge. Rainfall intensities decreased quite a bit from Sunday due the drier air working its way into the mid and upper-levels of the atmosphere. SNOTEL sites in area recorded 0.1 inches of rainfall on Monday. The highest CoCoRaHS station recorded 0.05 inches in Las Animas County, with most other stations receiving only trace amounts. Radar rainfall estimates were just under 0.5 inches.

To see how much precipitation over your neighborhood the last 72-hours, scroll down to the State Precipitation Map below.

Click Here For Map Overview

The map below shows radar-estimated, rainfall gage-adjusted Quantitative Precipitation Estimates (QPE) across Colorado. The map is updated daily during the operational season (May 1 – Sep 30) by 11AM. The following six layers are currently available: 24-hour, 48-hour and 72-hour total precipitation, as well as maximum 1-hour, 2-hour and 6-hour precipitation over the past 24 hour period (to estimate where flash flooding may have occurred). The 24-hour, 48-hour and 72-hour total precipitation contain bias corrections that are not disaggregated into the hourly estimates, so there will likely be some differences. The accumulation ending time is 7AM of the date shown in the bottom right corner. Also shown optionally are fire burn areas (post 2012), which are updated throughout the season to include new burn areas. The home button in the top left corner resets the map to the original zoom.