Issue Date: Friday, August 3rd, 2018
Issue Time: 09:45 AM MDT
Summary:
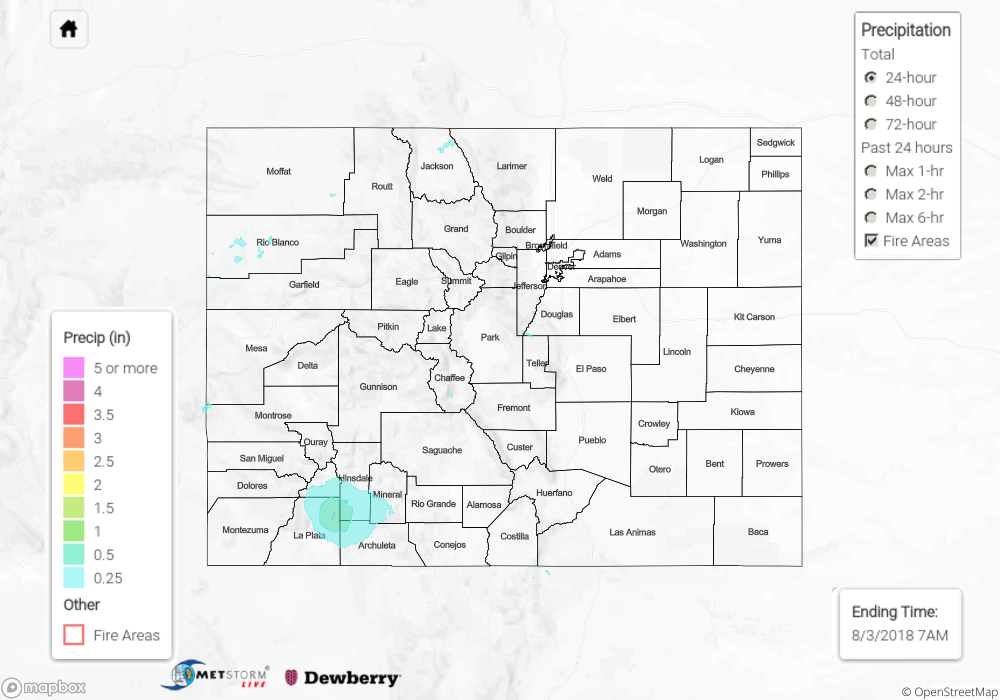
Another shortwave trough rounded the ridge and passed through the state on Thursday. Storms began to fire over the higher terrains in the mid-afternoon with the majority of the activity over western Colorado and the higher terrains. Without much instability from heavy cloud cover and haze, the weak thunderstorms and showers were pulse-like and short-lived. Showers continued overnight over the northwest corner of the state as the trough approached from the east and provided extra lift to keep the atmosphere active.
Most totals yesterday were just at or under 0.25 inches except over the southern San Juan Mountains. A CoCoRaHS station near Vallecito Lake reported 0.7 inches. The areal extent of the thunderstorms yesterday was not large, which helped limited excessive runoff and flash flooding potential over the burn scars. To the east, Alamosa recorded 0.08 inches. Over the eastern mountains, an Areal Flood Advisory was issued for the Junkins burn scar just after 7PM as a storm tracked directly over the burn scar. No flooding was reported as of this morning, and max 1-hour radar rainfall estimates were just under 0.25 inches.
To see how much precipitation over your area the last 72-hours, scroll down to the State Precipitation Map below.
Click Here For Map Overview
