Issue Date: Thursday, August 2nd, 2018
Issue Time: 09:35 AM MDT
Summary:
General increase in shower coverage during the afternoon hours thanks to a passing shortwave trough rounding the ridge. The shortwave started the morning over the northwest corner of the state, but without much instability and low-level moisture, cloud cover and virga were the main outcome. Throughout the day the shortwave traveled to the southeast and arrived to the Front Range and Southeast Mountains by mid-afternoon. Instability was greater over the southern mountains, Raton Ridge and Palmer Divide, so coverage of storms was greater over these area. Some weak thunderstorms were also able to form over the southern ridgelines of the San Juan Mountains.
For the most part, the lack of low-level moisture had the storms producing more gusty winds and dangerous lightning than wetting rainfalls. A CoCoRaHS near Arriba measured 0.6 inches with radar estimates up to 1 inch/hour. A USGS gage recorded just over 0.5 inches outside of Colorado Springs in the Black Forest. Small hail was also reported (0.88 inches) in the storm near Colorado City. 24-hour totals over the SNOTEL ranged from 0.1 – 0.3 inches over the Southeast and San Juan Mountains. Storm activity began to decrease from west to east after sundown. Lastly, a Flash Flood Warning was issued for the Spring Creek fire, but as of Thursday morning, there was no flooding reported.
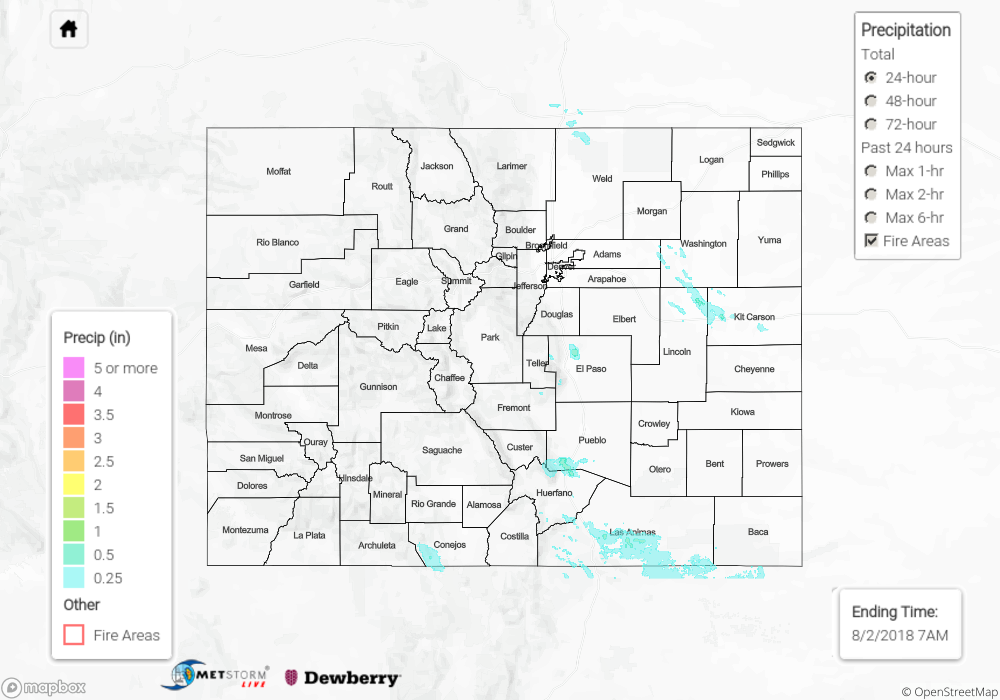
To see how much precipitation over your area yesterday, scroll down to the State Precipitation Map below.
Click Here For Map Overview