Issue Date: Saturday, August 11th, 2018
Issue Time: 09:15 AM MDT
Summary:
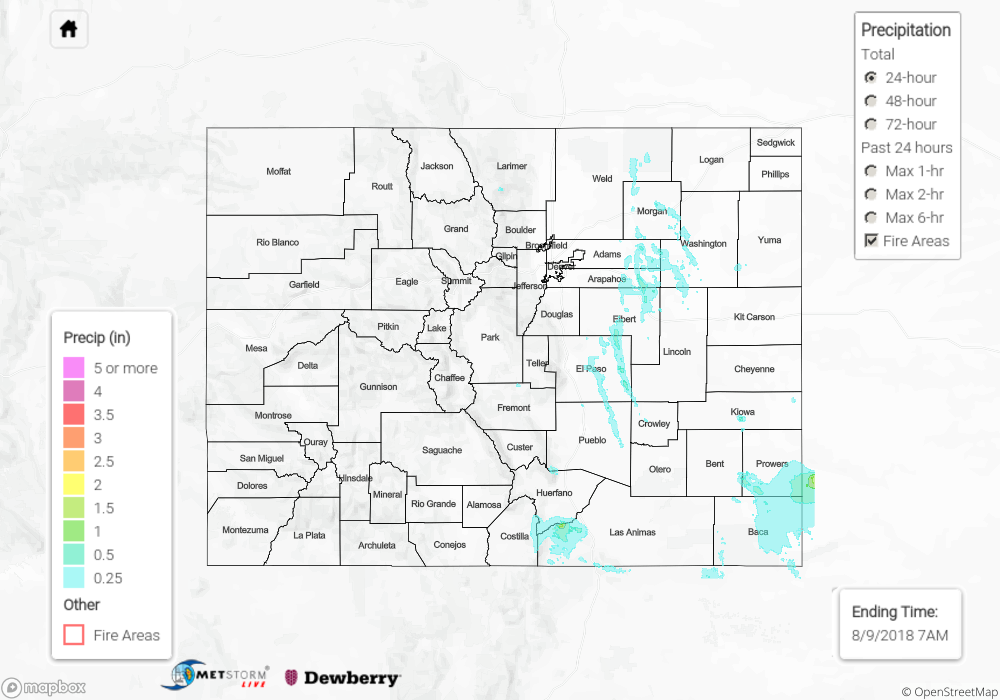
Two distinct batches of precipitation occurred across Colorado yesterday, neither of which produced particularly heavy precipitation or generated any reports of flooding. Somewhat unusually, a complex of storms formed in the very early morning hours of Friday over the Cheyenne Ridge and pushed southwards across the eastern plains throughout the morning. These storms were generally weak and short-lived, but rainfalls of 0.50” from 8.4 miles NNE of Burlington (Kit Carson County) and 0.30” from 6.4 miles WSW of Vernon (Yuma County) were reported by CoCoRaHS observers.
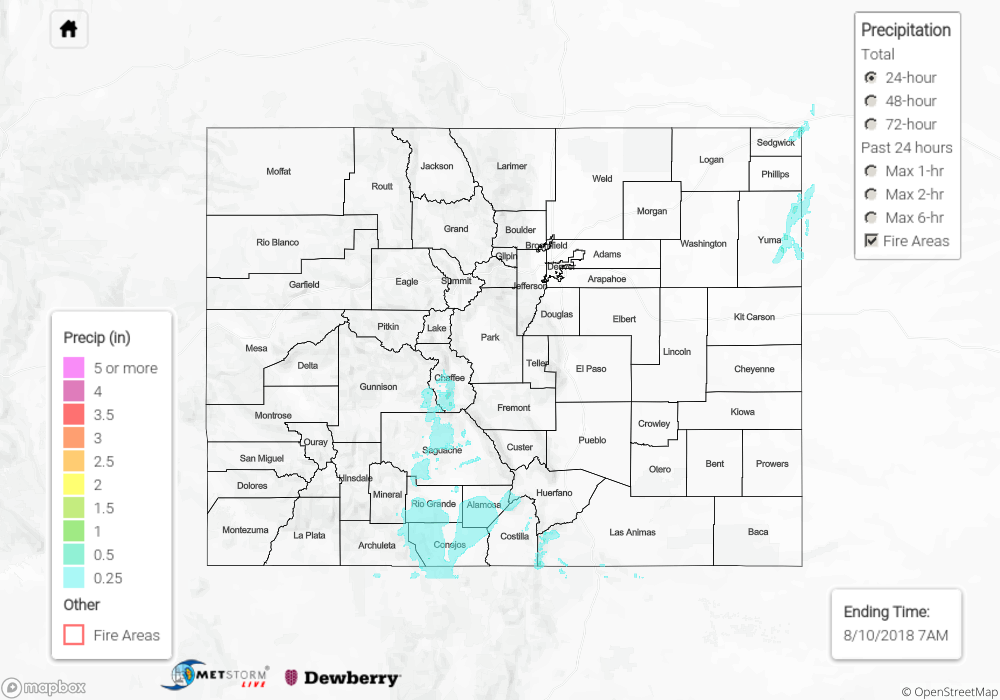
The top reports of the day, however, come from mountain locations, where scattered afternoon storms produced a few credible reports of precipitation greater than 0.50”:
- Pagosa Springs 1.6 SSW (Archuleta County): 0.89”
- Columbus Basin SNOTEL site (La Plata County): 0.60”
- Hoosier Pass SNOTEL site (border of Summit and Park Counties): 0.60”
Across much of the rest of the state, it was a mostly sunny and seasonably warm day.
To see how much precipitation fell over your area yesterday, scroll down to the State Precipitation Map below.
Click Here For Map Overview
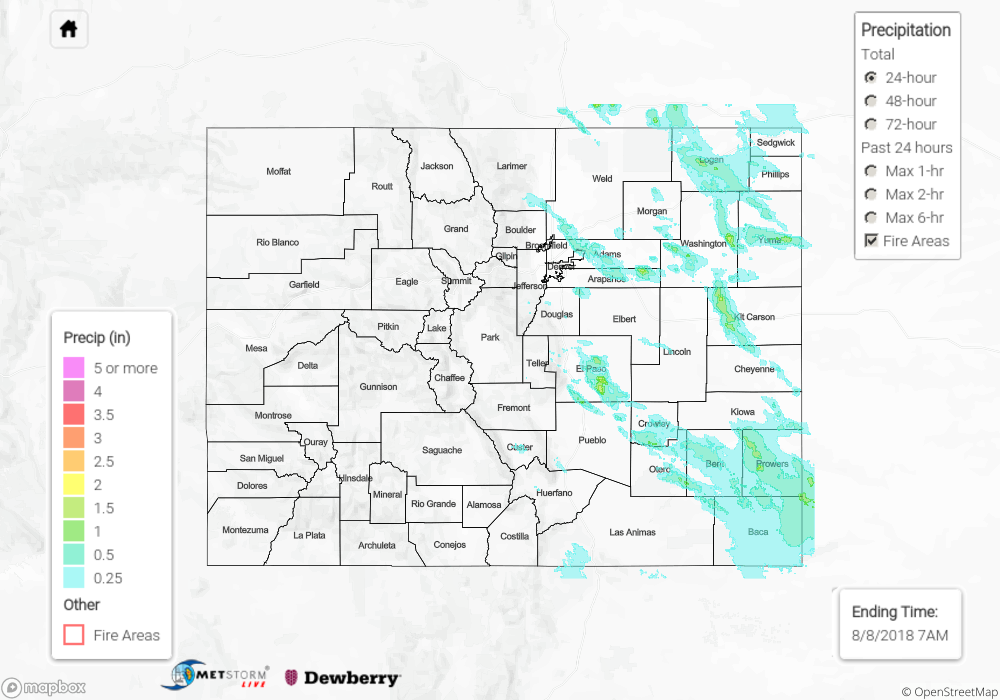
The map below shows radar-estimated, rainfall gage-adjusted Quantitative Precipitation Estimates (QPE) across Colorado. The map is updated daily during the operational season (May 1 – Sep 30) by 11AM. The following six layers are currently available: 24-hour, 48-hour and 72-hour total precipitation, as well as maximum 1-hour, 2-hour and 6-hour precipitation over the past 24 hour period (to estimate where flash flooding may have occurred). The 24-hour, 48-hour and 72-hour total precipitation contain bias corrections that are not disaggregated into the hourly estimates, so there will likely be some differences. The accumulation ending time is 6AM of the date shown in the bottom right corner. Also shown optionally are fire burn areas (post 2012), which are updated throughout the season to include new burn areas. The home button in the top left corner resets the map to the original zoom.