SPM 08-19-2018: Thunderstorms Rumbled as Upper-Level Low Moved Across the Rockies

Issue Date: Sunday, August 19th, 2018
Issue Time: 9:30 AM MDT

Summary:

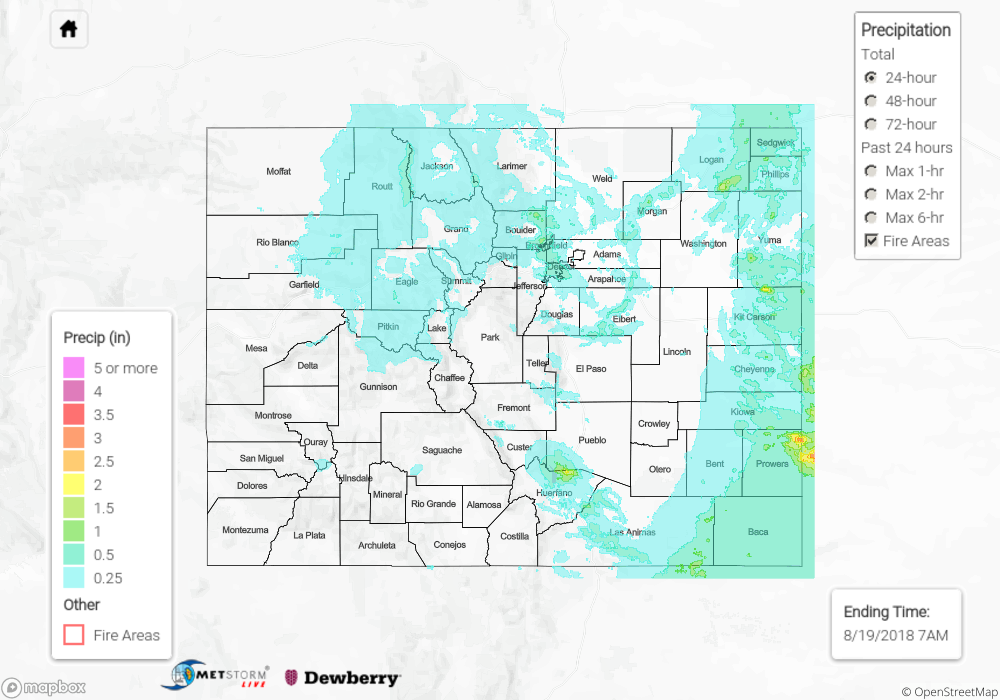
An upper-level low tracked across Wyoming yesterday, acting as the trigger mechanism for showers/thunderstorms across Colorado. The initial round of storms got an early start during the morning hours over the High Country, eventually impacting the Urban Corridor by 11:30 AM and the plains shortly thereafter. A few of these storms were strong, producing hail, strong winds, and periods of heavy rainfall (mainly east of I-25). As the first group of storms tracked east, another developed during the late evening/nighttime hours in response to a secondary disturbance, producing strong winds, small hail, periods of moderate-to-heavy rainfall, and plenty of lightning. Those that stayed for the entire Broncos preseason game likely experienced these storms on their way home from the game, and those at home that were already asleep may have been awakened by loud claps of thunder.

All in all, the good news of the day is that no flash flooding was reported, and the rain that fell can be categorized as beneficial. For a look at precipitation estimates in your area, please see the State Precipitation Map below.

Click Here For Map Overview

The map below shows radar-estimated, rainfall gage-adjusted Quantitative Precipitation Estimates (QPE) across Colorado. The map is updated daily during the operational season (May 1 – Sep 30) by 11AM. The following six layers are currently available: 24-hour, 48-hour and 72-hour total precipitation, as well as maximum 1-hour, 2-hour and 6-hour precipitation over the past 24 hour period (to estimate where flash flooding may have occurred). The 24-hour, 48-hour and 72-hour total precipitation contain bias corrections that are not disaggregated into the hourly estimates, so there will likely be some differences. The accumulation ending time is 7AM of the date shown in the bottom right corner. Also shown optionally are fire burn areas (post 2012), which are updated throughout the season to include new burn areas. The home button in the top left corner resets the map to the original zoom.

SPM 08-18-2018: Heavy Rain from Slow-Moving Storms Resulted in Flash Flooding

Issue Date: Saturday, August 18th, 2018
Issue Time: 9:30 AM MDT

Summary:

A mid-level disturbance rotated across the state yesterday, triggering widespread showers and thunderstorms across Colorado yesterday. West of the Continental Divide, activity could be classified as garden-variety, producing light-to-moderate rainfall and gusty winds. East of the Continental Divide, however, high moisture values provided the fuel for strong thunderstorms that produced heavy rainfall. Reports of flash flooding and flash flooding-related issues are as follows:

-Highway 96 in Custer County between mile marker 8 and 8 was washed out due to flooding. Multiple cars washed off the road.
-Flooded roadway at Date Street and Siferd Boulevard in Colorado Springs
-Street flooding at the intersection of Ruskin and Shelley in Colorado Springs
-Flooding of I-25 between mile markers 120 and 122. Six cars were swept off the roadway.
-Multiple dirt roads washed out in Pueblo County

For a look at precipitation estimates in your area, please see the State Precipitation Map below.

Click Here For Map Overview

The map below shows radar-estimated, rainfall gage-adjusted Quantitative Precipitation Estimates (QPE) across Colorado. The map is updated daily during the operational season (May 1 – Sep 30) by 11AM. The following six layers are currently available: 24-hour, 48-hour and 72-hour total precipitation, as well as maximum 1-hour, 2-hour and 6-hour precipitation over the past 24 hour period (to estimate where flash flooding may have occurred). The 24-hour, 48-hour and 72-hour total precipitation contain bias corrections that are not disaggregated into the hourly estimates, so there will likely be some differences. The accumulation ending time is 7AM of the date shown in the bottom right corner. Also shown optionally are fire burn areas (post 2012), which are updated throughout the season to include new burn areas. The home button in the top left corner resets the map to the original zoom.

SPM 08-17-2018: Increased Moisture Bumps 24-hour Totals over Western Colorado

Issue Date: Friday, August 17th, 2018
Issue Time: 10:00 AM MDT

Summary:

Another round of showers and thunderstorms fired over the southern high terrains on Thursday. Dry air continued to be entrained from the north, so not much action over the northern half of the state again. Totals were able to increase due to a slight upward tick in low-level moisture over western Colorado. A CoCoRaHS in Delta County reported 0.42 inches. Unfortunately, still no rain for Grand Junction. Pagosa Springs got 0.22 inches and its north, the Weminuche Creek SNOTEL station reported 0.5 inches. These were similar totals to stations over the western San Juans. A station in Del Norte reported 0.41 inches. The highest CoCoRaHS report for the day was in Pueblo, which reported 0.63 inches. Radar estimates indicate storms over the adjacent eastern plains produced rain rates just over 0.5 inches/hour.

Flooding was not reported on Thursday though there was an areal flood advisory and flash flood warning issued from the Pueblo office in the early evening. To see how much precipitation fell over your area, scroll down to the State Precipitation Map below.

Click Here For Map Overview

The map below shows radar-estimated, rainfall gage-adjusted Quantitative Precipitation Estimates (QPE) across Colorado. The map is updated daily during the operational season (May 1 – Sep 30) by 11AM. The following six layers are currently available: 24-hour, 48-hour and 72-hour total precipitation, as well as maximum 1-hour, 2-hour and 6-hour precipitation over the past 24 hour period (to estimate where flash flooding may have occurred). The 24-hour, 48-hour and 72-hour total precipitation contain bias corrections that are not disaggregated into the hourly estimates, so there will likely be some differences. The accumulation ending time is 7AM of the date shown in the bottom right corner. Also shown optionally are fire burn areas (post 2012), which are updated throughout the season to include new burn areas. The home button in the top left corner resets the map to the original zoom.

SPM 08-16-2018: Dry Air Causes Downtick in Heavy Rainfall Activity

Issue Date: Thursday, August 16th, 2018
Issue Time: 10:15 AM MDT

Summary:

Dry air associated with the upper-level trough was pushed into northern Colorado on Wednesday morning. This kept the northern half of the state pretty quiet during the afternoon hours. Residual moisture and a passing shortwave helped kick off some shower activity over the Central and San Juan Mountains. Though more cloud cover was apparent over the Central Mountains than wetting rains. Drier air kept rainfall totals over the San Juan Mountains in the 0.05 to 0.1 inch range as indicated by reporting SNOTEL and Mesonet stations. A bit heavier rainfall was present over the Southeast Mountains, Raton Ridge and Palmer Ridge. However, storms were quick to dissipate in the drier air as they moved off the higher terrains. Not much lightning associated with the widespread showers, so overall a nice soaking for the area. Some of the more convective storms over the adjacent plains produced rain rates just over 1 inch/hour, but after the bias correction, 24-hour totals were just under 1 inch.

A flash flood warning was issued for the Junkins burn scar and Spring Creek burn scar during the early evening hours. As of this morning, no flooding was reported. Radar estimated rainfall totals were up to 0.75 inches in the vicinity of the scars. To see how much precipitation fell over your area, scroll down to the State Precipitation Map below.

Click Here For Map Overview

The map below shows radar-estimated, rainfall gage-adjusted Quantitative Precipitation Estimates (QPE) across Colorado. The map is updated daily during the operational season (May 1 – Sep 30) by 11AM. The following six layers are currently available: 24-hour, 48-hour and 72-hour total precipitation, as well as maximum 1-hour, 2-hour and 6-hour precipitation over the past 24 hour period (to estimate where flash flooding may have occurred). The 24-hour, 48-hour and 72-hour total precipitation contain bias corrections that are not disaggregated into the hourly estimates, so there will likely be some differences. The accumulation ending time is 7AM of the date shown in the bottom right corner. Also shown optionally are fire burn areas (post 2012), which are updated throughout the season to include new burn areas. The home button in the top left corner resets the map to the original zoom.