Issue Date: Thursday, August 16th, 2018
Issue Time: 10:15 AM MDT
Summary:
Dry air associated with the upper-level trough was pushed into northern Colorado on Wednesday morning. This kept the northern half of the state pretty quiet during the afternoon hours. Residual moisture and a passing shortwave helped kick off some shower activity over the Central and San Juan Mountains. Though more cloud cover was apparent over the Central Mountains than wetting rains. Drier air kept rainfall totals over the San Juan Mountains in the 0.05 to 0.1 inch range as indicated by reporting SNOTEL and Mesonet stations. A bit heavier rainfall was present over the Southeast Mountains, Raton Ridge and Palmer Ridge. However, storms were quick to dissipate in the drier air as they moved off the higher terrains. Not much lightning associated with the widespread showers, so overall a nice soaking for the area. Some of the more convective storms over the adjacent plains produced rain rates just over 1 inch/hour, but after the bias correction, 24-hour totals were just under 1 inch.
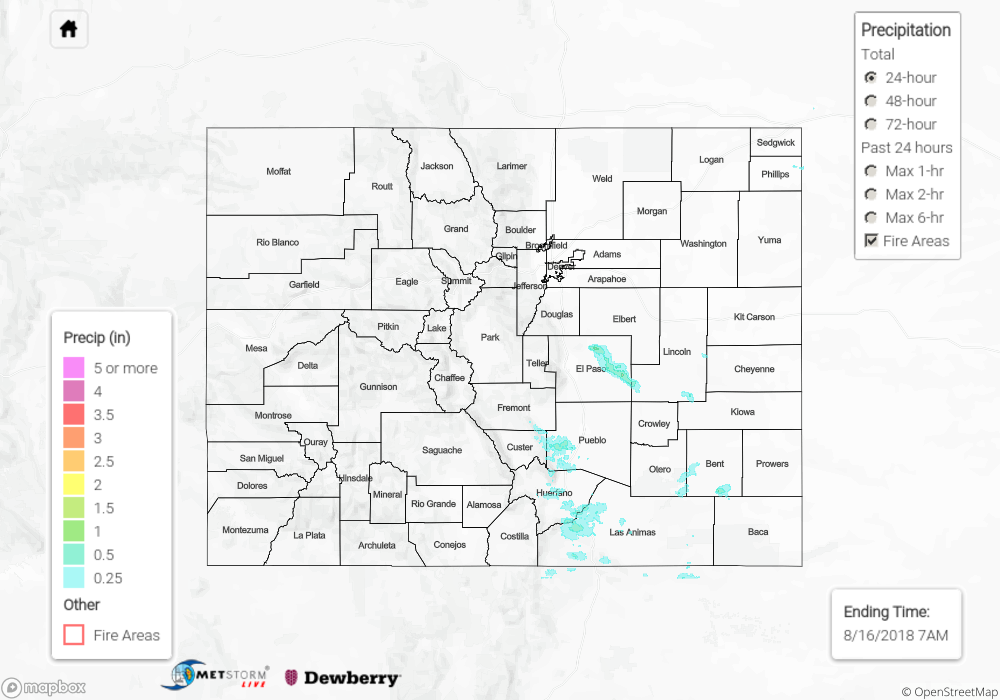
A flash flood warning was issued for the Junkins burn scar and Spring Creek burn scar during the early evening hours. As of this morning, no flooding was reported. Radar estimated rainfall totals were up to 0.75 inches in the vicinity of the scars. To see how much precipitation fell over your area, scroll down to the State Precipitation Map below.
Click Here For Map Overview