SPM 08-23-2018: Active Day of Storms, but no Flooding

Issue Date: Thursday, August 23rd, 2018
Issue Time: 10:25 AM MDT

Summary:

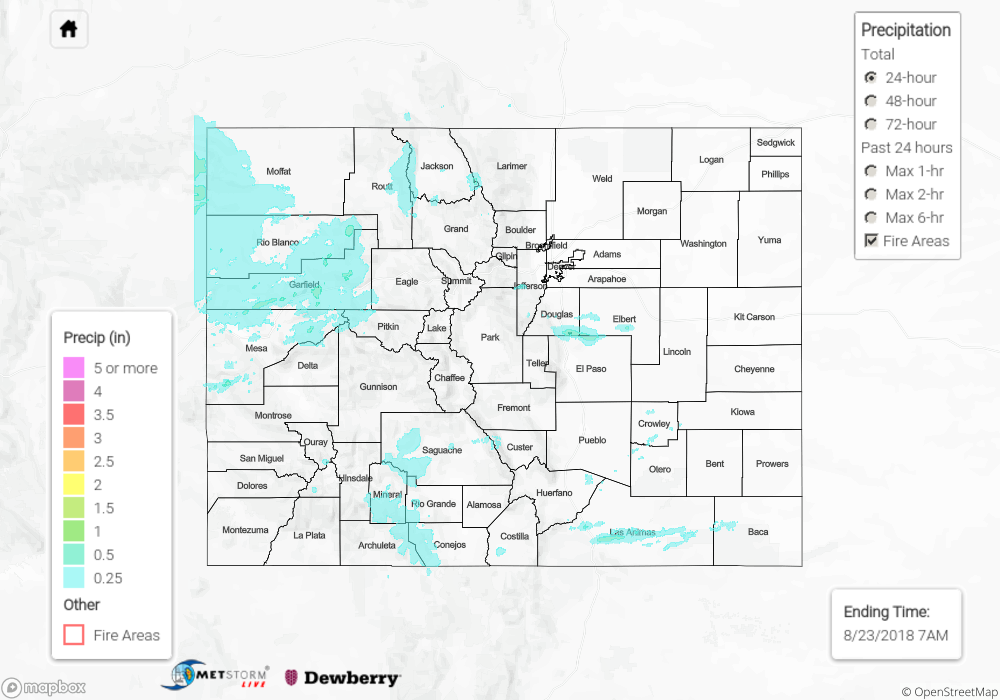
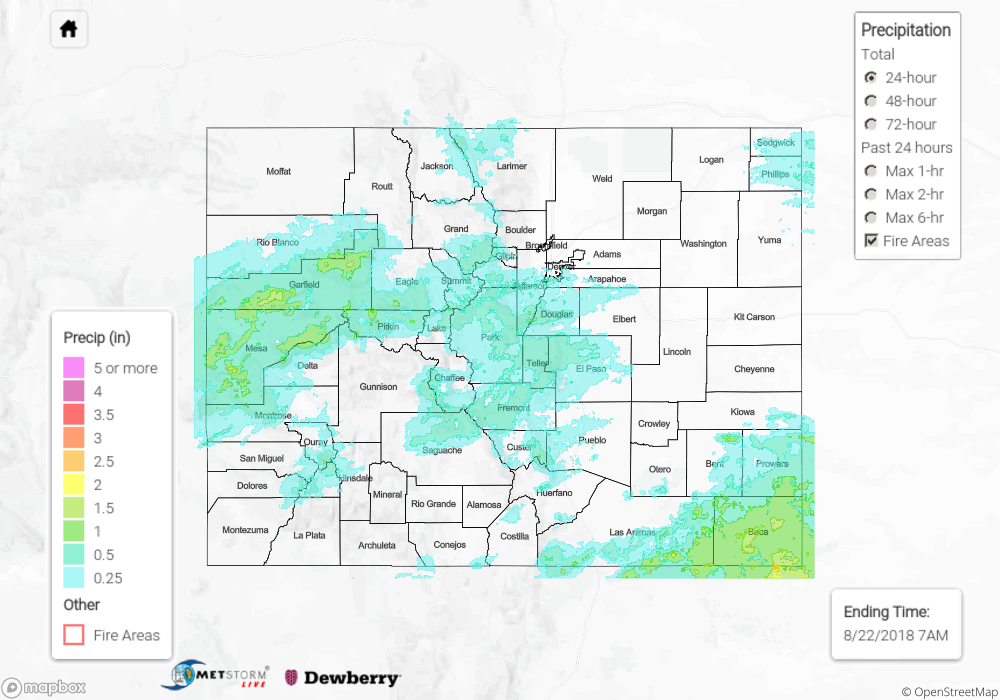
The surge of monsoon moisture that was forecast for yesterday did indeed arrive and make its mark across portions of the state. Portions of virtually every county in the state received some rain yesterday, but the vast majority of reports were for 0.1 inches or less. However, there were a handful of reliable reports of at least an inch of rainfall yesterday:

  • Grand Valley (Mesa County): 1.30”
  • Steamboat Springs 1W (Routt County): 1.26”
  • Gunsight (Grand County): 1.24”
  • Larkspur 7.1 ESE (Douglas County): 1.02”
  • Great Divide (Moffat County): 1.01”

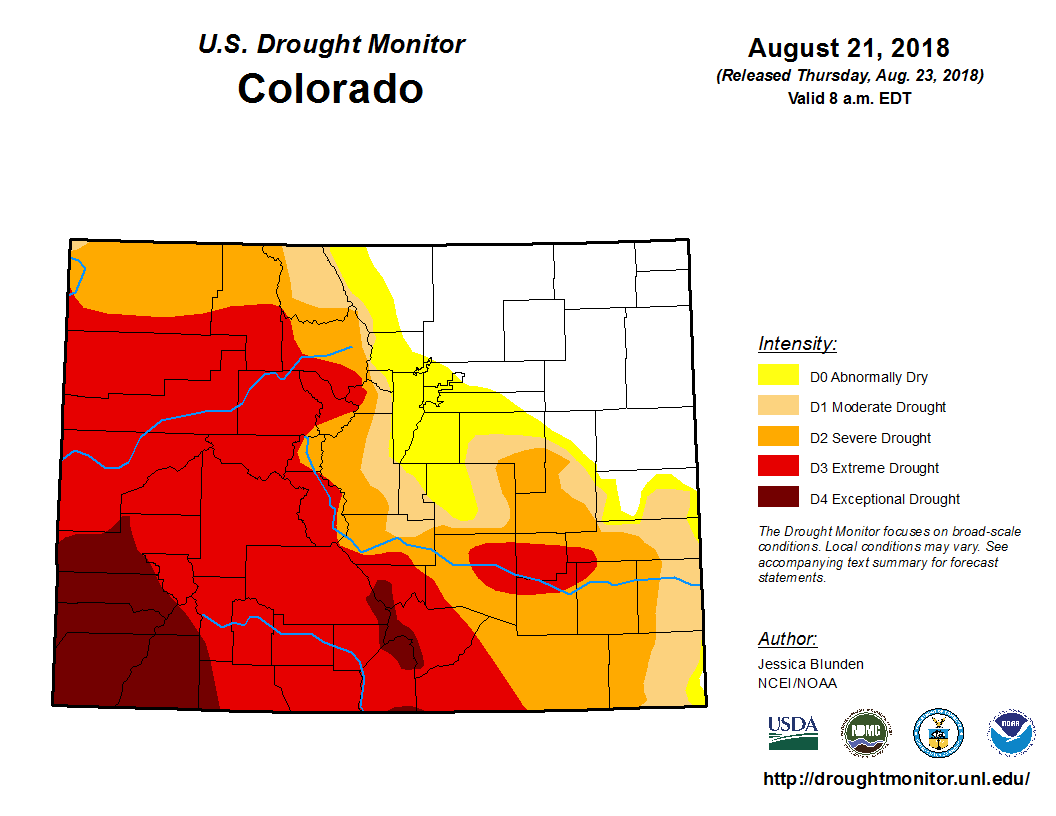
Notice that these locations spanned everywhere from the western slope to the north-central mountains to the plains near Colorado Springs. Some sub-severe hail was also reported with the Mesa and Garfield County storms, but no damage reports were received. After going much of the summer without any rain at all, the Grand Junction area finally received two days in a row of decent monsoon storms which cut their year-to-date rainfall deficit in half! Unfortunately, however, the southwestern 2/3rds of the state remains in deep drought (see Drought Monitor map below).

To see how much precipitation fell over your neighborhood yesterday, scroll down to the State Precipitation Map below.

Click Here For Map Overview

The map below shows radar-estimated, rainfall gage-adjusted Quantitative Precipitation Estimates (QPE) across Colorado. The map is updated daily during the operational season (May 1 – Sep 30) by 11AM. The following six layers are currently available: 24-hour, 48-hour and 72-hour total precipitation, as well as maximum 1-hour, 2-hour and 6-hour precipitation over the past 24 hour period (to estimate where flash flooding may have occurred). The 24-hour, 48-hour and 72-hour total precipitation contain bias corrections that are not disaggregated into the hourly estimates, so there will likely be some differences. The accumulation ending time is 7AM of the date shown in the bottom right corner. Also shown optionally are fire burn areas (post 2012), which are updated throughout the season to include new burn areas. The home button in the top left corner resets the map to the original zoom.

SPM 08-22-2018: Beneficial Rainfall and Cooler Temperatures

Issue Date: Wednesday, August 22nd, 2018
Issue Time: 10:00 AM MDT

Summary:

A traditional monsoon moisture surge began yesterday as the 500mb high slid eastward over Texas and a trough spun to our northwest. Together they helped usher subtropical moisture northwards throughout the day. Early morning cloud cover over northern CO associated with a shortwave limited convective rainfall along the CO/WY border. Over the Front Range, Urban Corridor and Northeast Plains rainfall amounts were light for the 24-hour period with radar estimates just over 0.25 inches.

Quite a different story over the Grand Valley and Central Mountains where heavy rainfall was reported. While 1-hour totals were under flood threat criteria, 24-hour totals were quite high over the very dry soils, which likely increased runoff. In Delta County there was a report of 1 inch. Mesa County had the highest observation of the day at 1.2 inches near Clifton. Garfield County also got in on the action with 1.18 inches over a 12 hour period. Radar rainfall estimations are as high as 1.5 inches. A debris flow was triggered by the rain around 5:30PM at the Redlands campground. Hail up to 1 inch and strong winds also were reported with the thunderstorms. Gusts between 50 to 65 mph were also recorded over western Colorado associated with the thunderstorms.

To the east, severe thunderstorms occurred over the far Southeast Plains during the afternoon before forming a cluster of thunderstorms during the evening hours. With dew points in the 60Fs over the far eastern plains, heavy rainfall occurred with the storms. 24-hour totals just under 2 inches were recorded, but no flooding was reported as of this morning. Dry soils and nearly full-grown crops likely helped soaked up the rain.

To see how much precipitation fell over your neighborhood yesterday, scroll down to the State Precipitation Map below.

Click Here For Map Overview

The map below shows radar-estimated, rainfall gage-adjusted Quantitative Precipitation Estimates (QPE) across Colorado. The map is updated daily during the operational season (May 1 – Sep 30) by 11AM. The following six layers are currently available: 24-hour, 48-hour and 72-hour total precipitation, as well as maximum 1-hour, 2-hour and 6-hour precipitation over the past 24 hour period (to estimate where flash flooding may have occurred). The 24-hour, 48-hour and 72-hour total precipitation contain bias corrections that are not disaggregated into the hourly estimates, so there will likely be some differences. The accumulation ending time is 7AM of the date shown in the bottom right corner. Also shown optionally are fire burn areas (post 2012), which are updated throughout the season to include new burn areas. The home button in the top left corner resets the map to the original zoom.

SPM 08-21-2018: Hazy Day with Dry Air Limiting Rainfall Totals

Issue Date: Tuesday, August 21st, 2018
Issue Time: 09:25 AM MDT

Summary:

Monday was quite hazy with the smoke from the west under the northwesterly/westerly flow aloft. Visibility was reduced to the 3-5 mile range for most areas over eastern Colorado. An upper disturbance and jet streak brought some light showers and weak thunderstorms to the norther portion of the state. Without much moisture in the air, rainfall totals were quite low. More virga and upper cloud cover was present over the lower valleys of western Colorado, but that is forecast to change the next couple of days. The highest CoCoRaHS report from Monday was in Routt County where 0.48 inches was recorded. The Stillwater Creek SNOTEL site in Grand picked up 0.4 inches in the 24-hour period. Radar estimates over the Northeast Plains along the CO/WY border were just over 0.25 inches. Flooding was not reported on Monday.

To see how much precipitation fell over your area the last 72-hours, scroll down to the State Precipitation Map below.

Click Here For Map Overview

The map below shows radar-estimated, rainfall gage-adjusted Quantitative Precipitation Estimates (QPE) across Colorado. The map is updated daily during the operational season (May 1 – Sep 30) by 11AM. The following six layers are currently available: 24-hour, 48-hour and 72-hour total precipitation, as well as maximum 1-hour, 2-hour and 6-hour precipitation over the past 24 hour period (to estimate where flash flooding may have occurred). The 24-hour, 48-hour and 72-hour total precipitation contain bias corrections that are not disaggregated into the hourly estimates, so there will likely be some differences. The accumulation ending time is 7AM of the date shown in the bottom right corner. Also shown optionally are fire burn areas (post 2012), which are updated throughout the season to include new burn areas. The home button in the top left corner resets the map to the original zoom.

SPM 08-20-2018: High Pressure Built back into CO, Bringing Quiet Weather Statewide

Issue Date: Monday, August 20th, 2018
Issue Time: 09:30 AM MDT

Summary:

Not much rainfall on Sunday as high pressure began to build back into the state and cooler temperatures kept convection capped. The trough that moved through on Saturday had moved to the east of Colorado and dry air was entrained on the backside. Some weak storms occurred over the Northeast Plains as a little bit moisture wrapped around the backside of the low. Radar rainfall estimates in the area were just over 0.25 inches. Some light showers also occurred over northern Front Range, with totals up to 0.2 inches. Flooding was not reported on Sunday.

To see how much precipitation fell over your area the last 72-hours, scroll down to the State Precipitation Map below.

Click Here For Map Overview

The map below shows radar-estimated, rainfall gage-adjusted Quantitative Precipitation Estimates (QPE) across Colorado. The map is updated daily during the operational season (May 1 – Sep 30) by 11AM. The following six layers are currently available: 24-hour, 48-hour and 72-hour total precipitation, as well as maximum 1-hour, 2-hour and 6-hour precipitation over the past 24 hour period (to estimate where flash flooding may have occurred). The 24-hour, 48-hour and 72-hour total precipitation contain bias corrections that are not disaggregated into the hourly estimates, so there will likely be some differences. The accumulation ending time is 7AM of the date shown in the bottom right corner. Also shown optionally are fire burn areas (post 2012), which are updated throughout the season to include new burn areas. The home button in the top left corner resets the map to the original zoom.