Issue Date: Wednesday, August 22nd, 2018
Issue Time: 10:00 AM MDT
Summary:
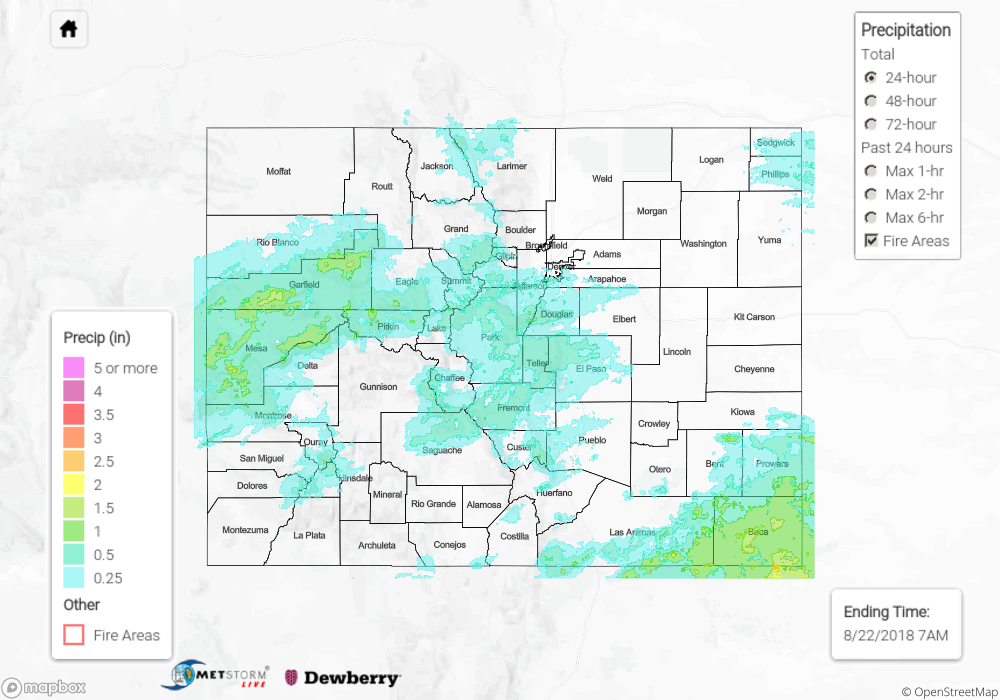
A traditional monsoon moisture surge began yesterday as the 500mb high slid eastward over Texas and a trough spun to our northwest. Together they helped usher subtropical moisture northwards throughout the day. Early morning cloud cover over northern CO associated with a shortwave limited convective rainfall along the CO/WY border. Over the Front Range, Urban Corridor and Northeast Plains rainfall amounts were light for the 24-hour period with radar estimates just over 0.25 inches.
Quite a different story over the Grand Valley and Central Mountains where heavy rainfall was reported. While 1-hour totals were under flood threat criteria, 24-hour totals were quite high over the very dry soils, which likely increased runoff. In Delta County there was a report of 1 inch. Mesa County had the highest observation of the day at 1.2 inches near Clifton. Garfield County also got in on the action with 1.18 inches over a 12 hour period. Radar rainfall estimations are as high as 1.5 inches. A debris flow was triggered by the rain around 5:30PM at the Redlands campground. Hail up to 1 inch and strong winds also were reported with the thunderstorms. Gusts between 50 to 65 mph were also recorded over western Colorado associated with the thunderstorms.
To the east, severe thunderstorms occurred over the far Southeast Plains during the afternoon before forming a cluster of thunderstorms during the evening hours. With dew points in the 60Fs over the far eastern plains, heavy rainfall occurred with the storms. 24-hour totals just under 2 inches were recorded, but no flooding was reported as of this morning. Dry soils and nearly full-grown crops likely helped soaked up the rain.
To see how much precipitation fell over your neighborhood yesterday, scroll down to the State Precipitation Map below.
Click Here For Map Overview