Issue Date: Saturday, September 8th, 2018
Issue Time: 9:30 AM MDT
Summary:
The meandering upper-level trough shifted across Colorado yesterday, resulting in more sunshine and slightly warmer temperatures across the state as compared to Thursday. The Eastern Plains held on to their cloud cover and fog the longest, thanks to weak, low-level, easterly flow during the morning hours. As temperatures warmed into the afternoon, a few isolated showers/thunderstorms dotted the High Country, with a couple isolated showers east of I-25. Light rain and gusty winds were the main impacts. All shower activity came to an end by 9 PM.
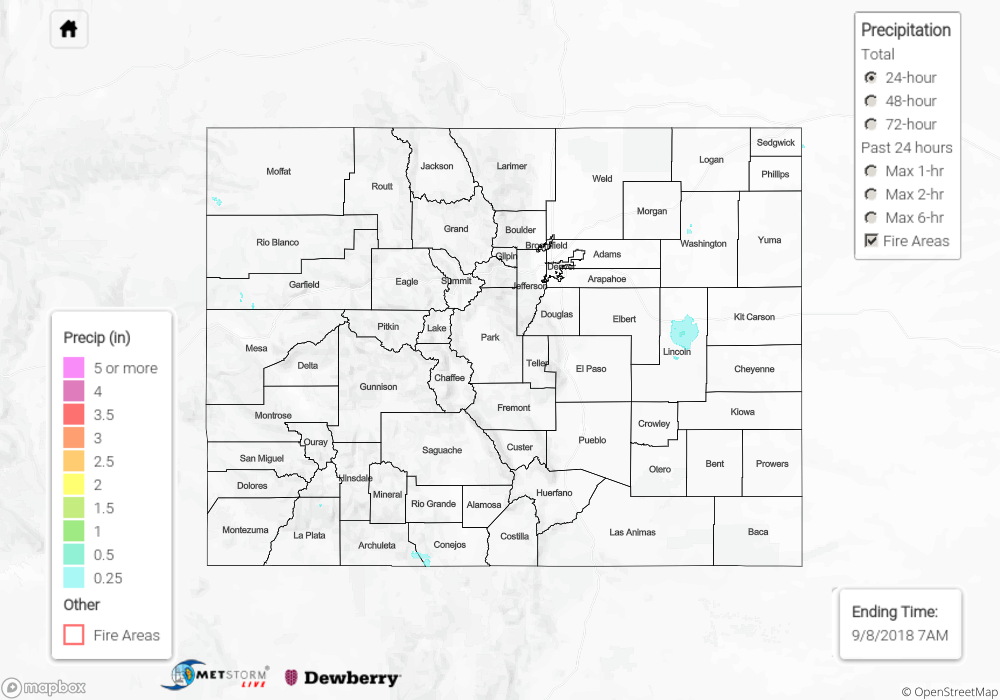
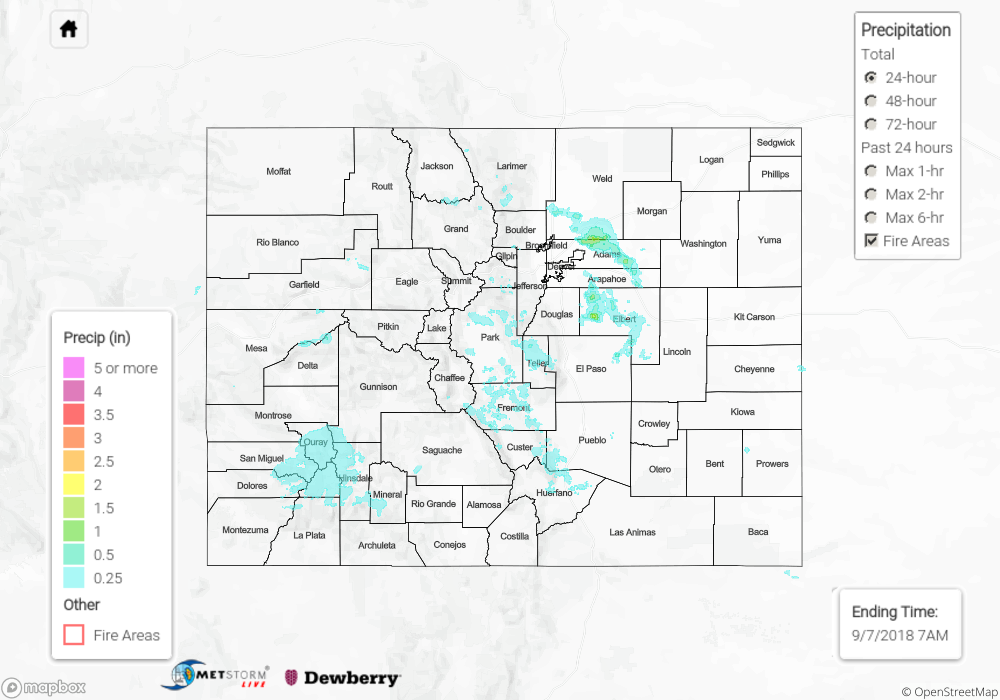
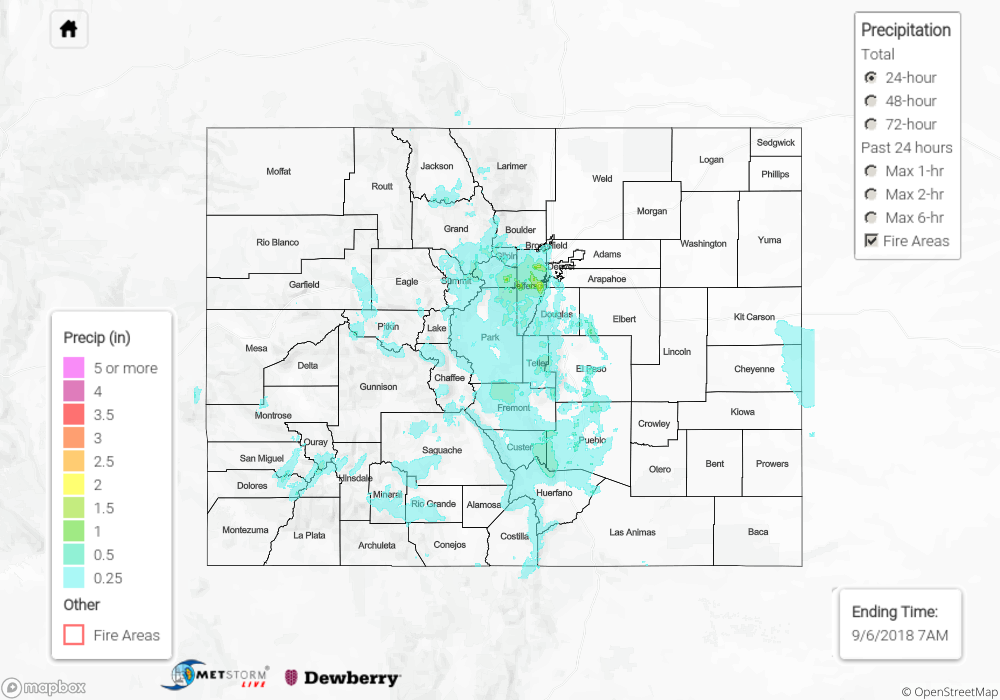
No flash flooding was reported yesterday. For a look at precipitation estimates in your area, please see the State Precipitation Map below.
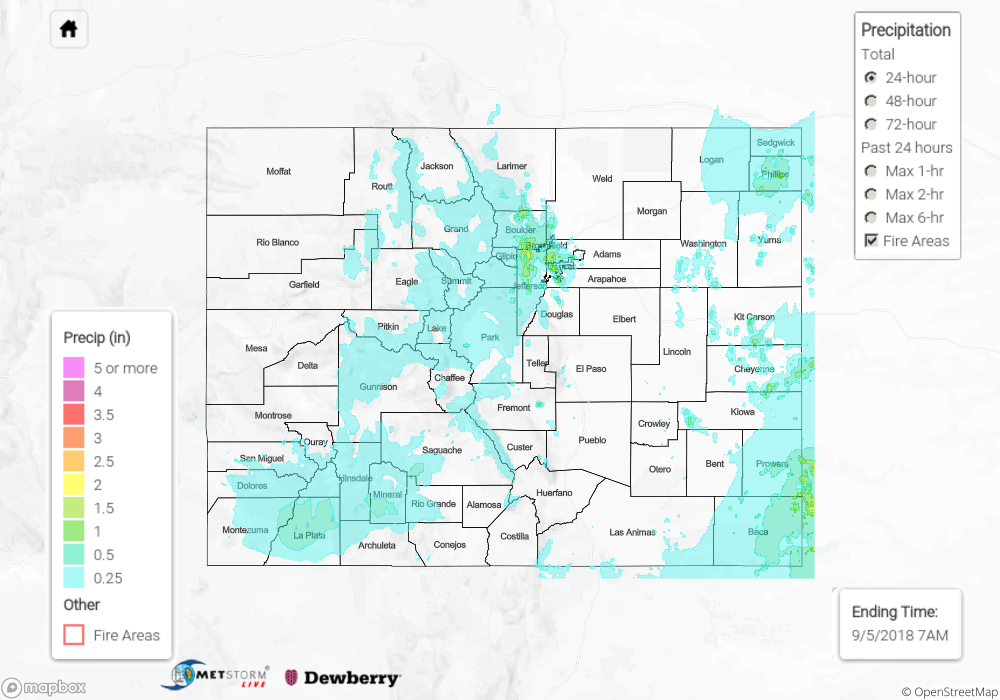
Click Here For Map Overview
The map below shows radar-estimated, rainfall gage-adjusted Quantitative Precipitation Estimates (QPE) across Colorado. The map is updated daily during the operational season (May 1 – Sep 30) by 11AM. The following six layers are currently available: 24-hour, 48-hour and 72-hour total precipitation, as well as maximum 1-hour, 2-hour and 6-hour precipitation over the past 24 hour period (to estimate where flash flooding may have occurred). The 24-hour, 48-hour and 72-hour total precipitation contain bias corrections that are not disaggregated into the hourly estimates, so there will likely be some differences. The accumulation ending time is 7AM of the date shown in the bottom right corner. Also shown optionally are fire burn areas (post 2012), which are updated throughout the season to include new burn areas. The home button in the top left corner resets the map to the original zoom.