Issue Date: Thursday, September 6th, 2018
Issue Time: 10:10 AM MDT
Summary:
Post-frontal moisture return put PW values at Denver and Grand Junction in the 90th percentile for this time of year on Wednesday. Overnight rainfall on Tuesday was a strong indication of the potential for heavy rainfall yesterday. During the morning hours, dew point along the Urban Corridor were in the mid-50Fs. The air itself felt quite humid. By early afternoon, storms began to fire along the higher terrains and were aided with upper-level support of a passing vorticity max. With nearly stationary storms in a high moisture environment, quite a bit of rainfall fell yesterday. Just a reminder that Pueblo’s radar is down for routine maintenance from 8AM on September 5th – 5PM on September 9th. This may affect some of the totals in the SPM below as ground observations were the best estimate of rainfall over the Pueblo forecast area. More details here: Pueblo Weather Radar Outage
A strong storm moved into the Urban Corridor during the afternoon hours and dropped quite a bit of hail with the low top thunderstorms. Guessing this inflated some of the rainfall observations, though quite a bit of rainfall did occur. Flooding was reported at Kipling and 25th Avenue in Lakewood around 4:30 PM with some cars stalled out in the same area. An Areal Flood Advisory was issued for this storm. Radar estimated up to 2 inches of rain fell over Jefferson County in the 1 to 2 hour period. Snow was reported above 13,000 feet with totals in Clear Creek up to 1.5 inches. An Areal Flood Advisory was also issued for this area. The Southeast Mountains also had storm totals over 1 inch as indicated by observations, which are not included on the SPM below. Over the San Juan Mountains totals were just over 0.5 inches with totals in the Central Mountains between 0.3 and 0.4 inches.
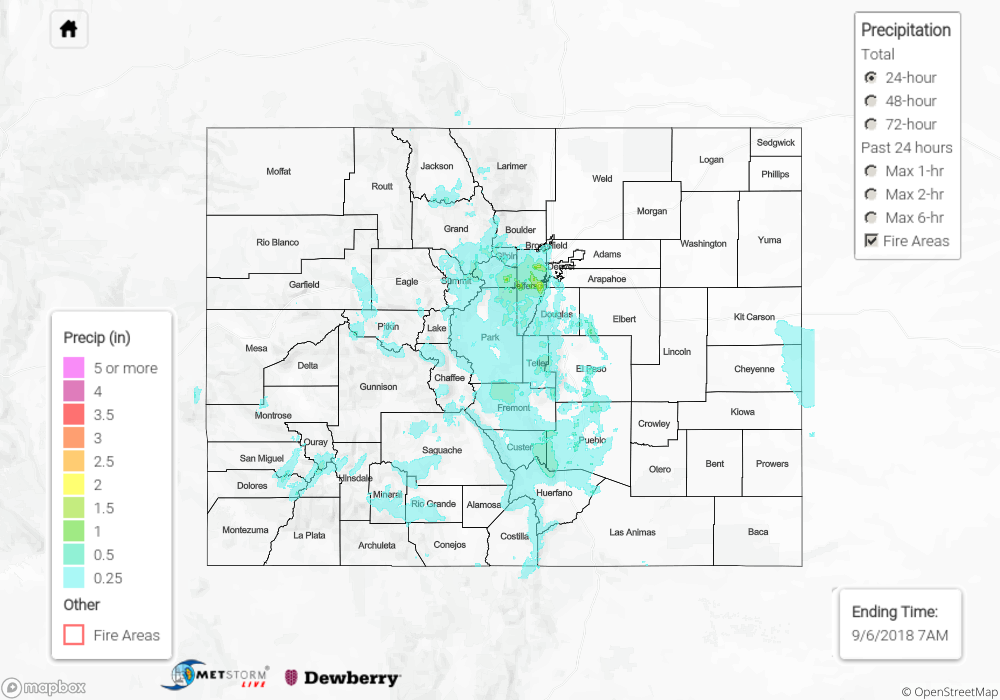
To see how much precipitation fell over your area yesterday, scroll down to the State Precipitation Map below.
Click Here For Map Overview
The map below shows radar-estimated, rainfall gage-adjusted Quantitative Precipitation Estimates (QPE) across Colorado. The map is updated daily during the operational season (May 1 – Sep 30) by 11AM. The following six layers are currently available: 24-hour, 48-hour and 72-hour total precipitation, as well as maximum 1-hour, 2-hour and 6-hour precipitation over the past 24 hour period (to estimate where flash flooding may have occurred). The 24-hour, 48-hour and 72-hour total precipitation contain bias corrections that are not disaggregated into the hourly estimates, so there will likely be some differences. The accumulation ending time is 7AM of the date shown in the bottom right corner. Also shown optionally are fire burn areas (post 2012), which are updated throughout the season to include new burn areas. The home button in the top left corner resets the map to the original zoom.