Issue Date: Friday, September 7th, 2018
Issue Time: 09:30 AM MDT
Summary:
High low-level moisture and slow steering winds combined for another day of heavy rainfall in the mountains. Over western CO, a bit more dry air had worked its way in from the west, so storms were more isolated on Thursday when compared to Wednesday. The most widespread rainfall was over the San Juan Mountains were radar indicates 0.25-0.4 inches of rainfall fell. In northern Delta County, the Park Reservoir SNOTEL recorded 1.1 inches for the 24-hour period.
Over eastern Colorado, the DCVZ set up, which allowed storms to form over the adjacent plains in addition to the mountains. One inch of rain was recorded over northern Adams County with the heaviest rainfall over western Elbert County. A CoCoRaHS station near Simla recorded 1 inch. Over the Southeast Mountains, the largest observation of the day occurred. A CoCoRaHS station recorded 1.29 inches near Cotopaxi. This storm trigged major flash flooding at Butter Creek likely due to increased runoff over the Hayden Pass burn scar. Thankfully, no injuries or damage were reported.
To see how much precipitation fell over your area yesterday, scroll down to the State Precipitation Map below. Just a reminder that Pueblo’s radar is down for routine maintenance from 8AM on September 5th – 5PM on September 9th. This may affect some of the totals in the SPM below and ground observations are the best estimate of rainfall over the Pueblo forecast area. More details here: Pueblo Weather Radar Outage
Click Here For Map Overview
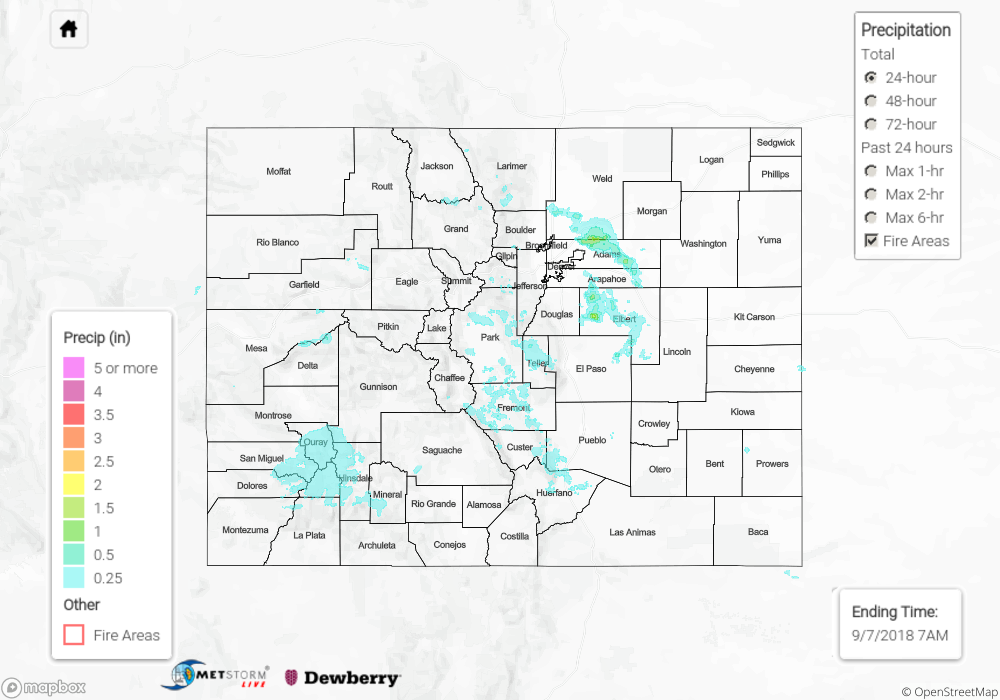
The map below shows radar-estimated, rainfall gage-adjusted Quantitative Precipitation Estimates (QPE) across Colorado. The map is updated daily during the operational season (May 1 – Sep 30) by 11AM. The following six layers are currently available: 24-hour, 48-hour and 72-hour total precipitation, as well as maximum 1-hour, 2-hour and 6-hour precipitation over the past 24 hour period (to estimate where flash flooding may have occurred). The 24-hour, 48-hour and 72-hour total precipitation contain bias corrections that are not disaggregated into the hourly estimates, so there will likely be some differences. The accumulation ending time is 7AM of the date shown in the bottom right corner. Also shown optionally are fire burn areas (post 2012), which are updated throughout the season to include new burn areas. The home button in the top left corner resets the map to the original zoom.