SPM 05-25-2019: Isolated Light Showers over Portions of the High Country, Dry Elsewhere

Issue Date: Saturday, May 25th, 2019
Issue Time: 9:10 AM MDT

Summary:

After days of cool and cloudy weather, Mother Nature finally relented and allowed Colorado to experience a bit more sunshine and warmer temperatures. Partly sunny skies were in place across much of the High Country and over the Palmer Ridge during the afternoon and evening, with the San Luis Valley and most of the lower elevations of eastern Colorado under sunny skies. Overall, it was a dry day across the state, aside from a few isolated light showers over the higher terrain of the Northwest Slope and Northern Mountains.

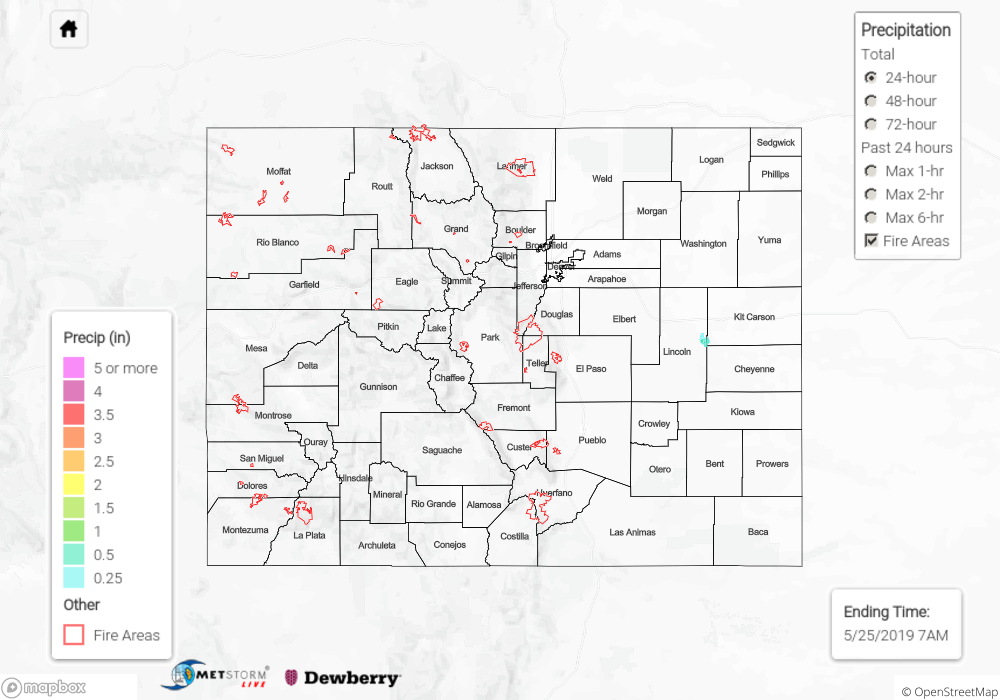
No flash flooding was reported yesterday. For a look at precipitation estimates in your area, please see the State Precipitation Map below. NOTE: The small area of precipitation depicted east of Limon is an error – that is the location of a wind farm, and it produced returns in the radar data.

Click Here For Map Overview

The map below shows radar-estimated, rainfall gage-adjusted Quantitative Precipitation Estimates (QPE) across Colorado. The map is updated daily during the operational season (May 1 – Sep 30) by 11AM. The following six layers are currently available: 24-hour, 48-hour and 72-hour total precipitation, as well as maximum 1-hour, 2-hour and 6-hour precipitation over the past 24 hour period (to estimate where flash flooding may have occurred). The 24-hour, 48-hour and 72-hour total precipitation contain bias corrections that are not disaggregated into the hourly estimates, so there will likely be some differences. The accumulation ending time is 7AM of the date shown in the bottom right corner. Also shown optionally are vulnerable fire burn areas (post 2012), which are updated throughout the season to include new, vulnerable burn areas. The home button in the top left corner resets the map to the original zoom.

SPM 05-24-2019: Widespread Rainfall for Western Colorado & More Snow for the Mountains

Issue Date: Friday, May 24th, 2019
Issue Time: 9:05AM MDT

Summary:

A quick moving system brought widespread showers to western Colorado yesterday. A cold front moved through during the afternoon hours, which dropped the snow line and allowed for decent accumulations above 8K feet. Vail reported another 3.5 inches of snow. For rainfall, the highest 24-hour total was over Garfield County near De Beque where 0.69 inches was recorded. Overall, widespread totals were 0.25 inches or higher. With saturated soils, rises were noted in the rivers and creeks, but no flooding was reported with levels well below Action stage. Windy conditions were also present over with the jet overhead. A gust of 60 mph was recorded over Rifle with another gust of 67 mph recorded at the Alamosa Airport ASOS. Over the eastern border, weak thunderstorms formed over the border counties during the late morning into the afternoon where up to 0.5 inches was estimated to have fallen from radar.

To see estimated precipitation totals from Thursday, scroll down to the State Precipitation Map below.

Click Here For Map Overview

The map below shows radar-estimated, rainfall gage-adjusted Quantitative Precipitation Estimates (QPE) across Colorado. The map is updated daily during the operational season (May 1 – Sep 30) by 11AM. The following six layers are currently available: 24-hour, 48-hour and 72-hour total precipitation, as well as maximum 1-hour, 2-hour and 6-hour precipitation over the past 24 hour period (to estimate where flash flooding may have occurred). The 24-hour, 48-hour and 72-hour total precipitation contain bias corrections that are not disaggregated into the hourly estimates, so there will likely be some differences. The accumulation ending time is 7AM of the date shown in the bottom right corner. Also shown optionally are vulnerable fire burn areas (post 2012), which are updated throughout the season to include new, vulnerable burn areas. The home button in the top left corner resets the map to the original zoom.

SPM 05-23-2019: Isolated Storms for Western Colorado with Rainfall/Snow Increasing Early this Morning

Issue Date: Thursday, May 23rd, 2019
Issue Time: 9:15AM MDT

Summary:

There was a break in the rainfall for eastern Colorado between the two troughs on Wednesday. Residual moisture and upslope flow combined for some light shower activity over the Front Range. SNOTEL indicating totals were up to 0.75 inches along the Divide in Park County where 4-6 inches of snow were recorded. Elsewhere, totals were between 0.1 and 0.3 inches with 2 inches of snow reported at Rabbit Ears Pass. The deepening system over the Desert Southwest helped initiate scattered storms over western Colorado in two distinct waves. One occurred yesterday afternoon into the evening, and the other began early this morning as the upper jet moved into the region. Hail (0.25 inches) and gusts (45 mph) were reported with some stronger afternoon storms over the lower, western valleys. Total precipitation this morning was measured at 0.5 inches in western Garfield County and over NE Montezuma County. Elsewhere, totals along the western border and western high terrains were between 0.1 and 0.25 inches. Flooding was not reported.

To see precipitation totals from Wednesday in your neighborhood, scroll down to the State Precipitation Map below.

Click Here For Map Overview

The map below shows radar-estimated, rainfall gage-adjusted Quantitative Precipitation Estimates (QPE) across Colorado. The map is updated daily during the operational season (May 1 – Sep 30) by 11AM. The following six layers are currently available: 24-hour, 48-hour and 72-hour total precipitation, as well as maximum 1-hour, 2-hour and 6-hour precipitation over the past 24 hour period (to estimate where flash flooding may have occurred). The 24-hour, 48-hour and 72-hour total precipitation contain bias corrections that are not disaggregated into the hourly estimates, so there will likely be some differences. The accumulation ending time is 7AM of the date shown in the bottom right corner. Also shown optionally are vulnerable fire burn areas (post 2012), which are updated throughout the season to include new, vulnerable burn areas. The home button in the top left corner resets the map to the original zoom.

SPM 05-22-2019: Another Cold Night with Freezing Temperatures over the Plains

Issue Date: Wednesday, May 22nd, 2019
Issue Time: 9:15AM MDT

Summary:

Another cold one overnight. Low temperatures dropped to freezing over the lower elevations of the eastern plains and Northwest Slope. The highest temperature yesterday was over Grand Junction where the 60°F mark was recorded. Elsewhere, temperatures were quite a bit below average for the end of May. Ongoing showers were present over the eastern plains in the deformation zone of the low. The heaviest 24-hour totals were recorded over the Northeast Plains. Radar estimations indicate 24-hour totals up to 1.5 inches with more general totals between 0.5 and 1 inch. Most all precipitation fell as snow over the Central and Northern Mountains with radar indicating heavy precipitation over Garfield County. Not many reports in this morning, but Avon received 2.3 inches. Heavy snow also fell in the San Juan Mountains with the snow level dropping to 7.5K feet. In Rockland, CO there was a report this morning with 8.1 inches falling overnight. Flooding was not reported.

To see precipitation totals from Tuesday, scroll down to the State Precipitation Map below.

Click Here For Map Overview

The map below shows radar-estimated, rainfall gage-adjusted Quantitative Precipitation Estimates (QPE) across Colorado. The map is updated daily during the operational season (May 1 – Sep 30) by 11AM. The following six layers are currently available: 24-hour, 48-hour and 72-hour total precipitation, as well as maximum 1-hour, 2-hour and 6-hour precipitation over the past 24 hour period (to estimate where flash flooding may have occurred). The 24-hour, 48-hour and 72-hour total precipitation contain bias corrections that are not disaggregated into the hourly estimates, so there will likely be some differences. The accumulation ending time is 7AM of the date shown in the bottom right corner. Also shown optionally are vulnerable fire burn areas (post 2012), which are updated throughout the season to include new, vulnerable burn areas. The home button in the top left corner resets the map to the original zoom.