SPM 06-02-2019: Thunderstorms Rumbled Mainly East of the Continental Divide

Issue Date: Sunday, June 2nd, 2019
Issue Time: 9:10 AM MDT

Summary:

It was the first day of Meteorological Summer yesterday and Mother Nature provided Colorado with a early summer-like day. High pressure ridging built overhead, allowing temperatures to climb a few degrees warmer than Friday. This heating allowed for the development of a few isolated showers/weak thunderstorms west of the Divide, mainly north of I-70, as well as scattered thunderstorms east of the Divide. The storms to the east were fueled by better moisture as easterly upslope flow brought upper 40s/low 50s dewpoints back into the area, resulting in a few strong/severe storms. The main “show” occurred just after 1 PM and continued until about 9 PM across eastern Colorado, but a couple showers/weak thunderstorms occurred over the Palmer Ridge between 11 PM and 3 AM. Large hail was the main severe impact, while heavy rain attended the strongest storms. Severe storm reports submitted to the National Weather Service are as follows:

1.75 inch hail: 4 miles ESE of Foxfield (Arapahoe County)
1.50 inch hail: 3 miles S of Arapahoe Park (Arapahoe County)
1.00 inch hail: 1 mile NNE of Centennial, and 2 miles NW of Aurora where it accumulated to 2 inches deep (Arapahoe County)

Accumulating hail was an issue on some roadways, including CR 105 and Highway 86 (11 miles NNW of Simla) in Elbert county, where hail piled up to 3 inches across the roadway.

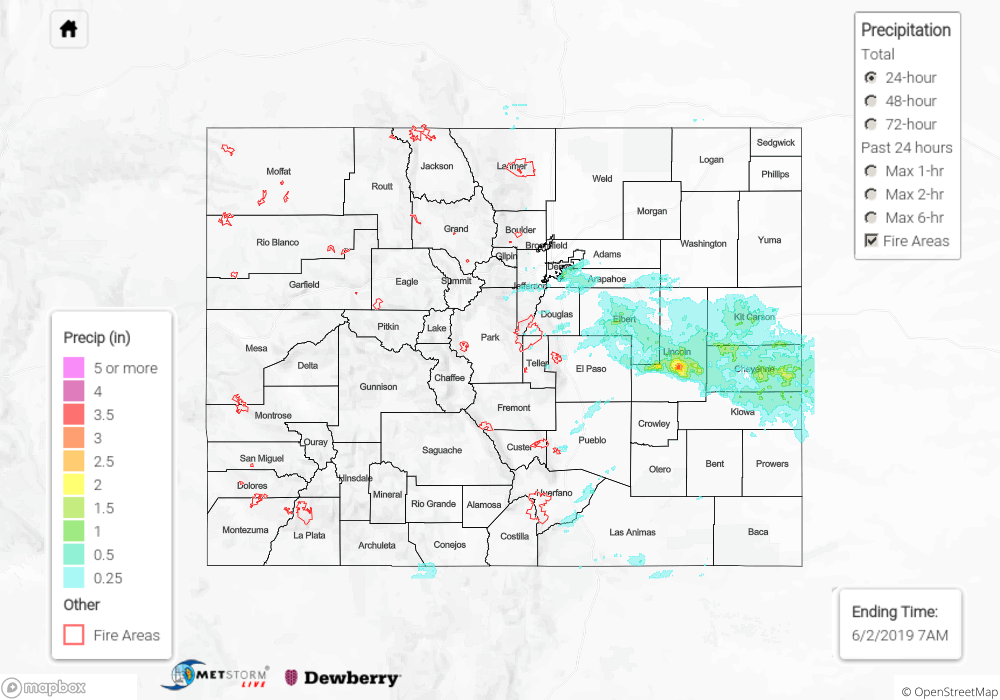
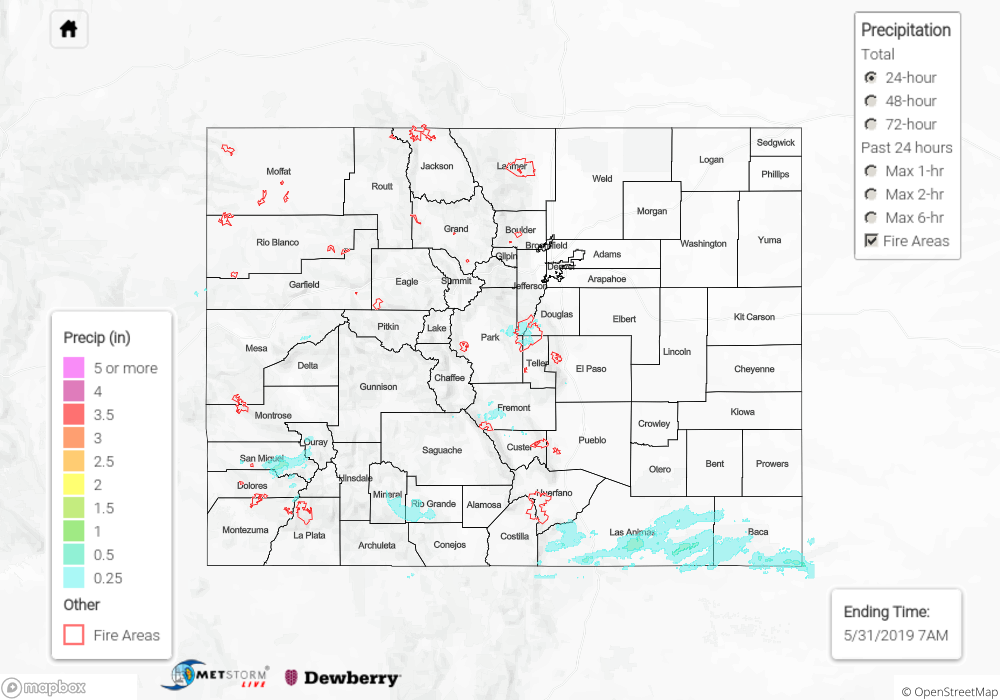
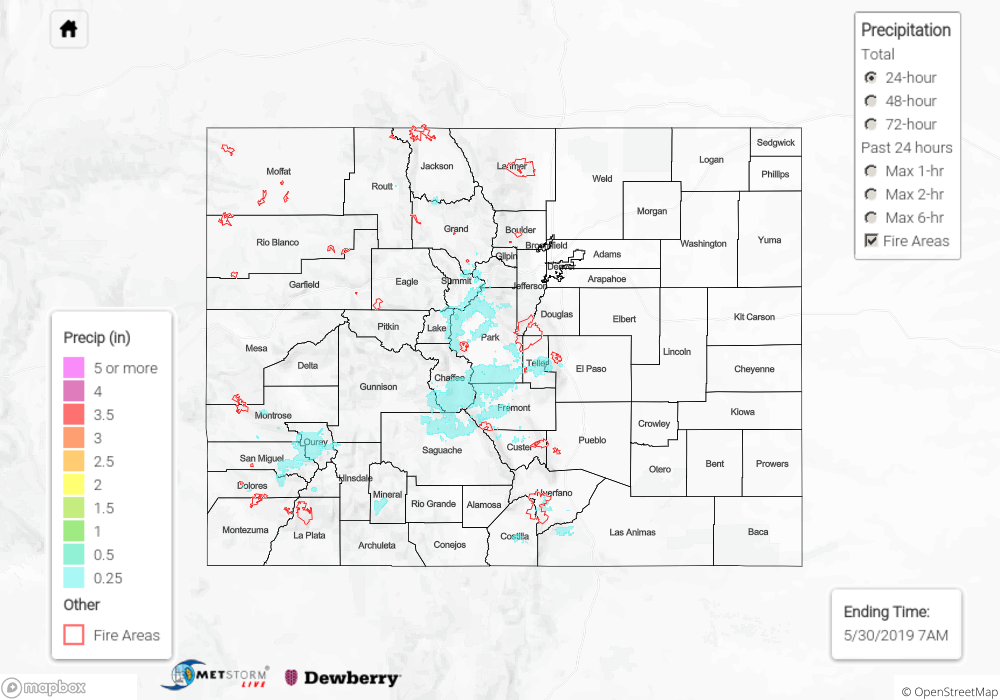
No flash flooding was reported yesterday, but a flash flood warning was issued for western Cheyenne County. For a look at precipitation estimates in your area, please see the State Precipitation Map below.

Click Here For Map Overview

The map below shows radar-estimated, rainfall gage-adjusted Quantitative Precipitation Estimates (QPE) across Colorado. The map is updated daily during the operational season (May 1 – Sep 30) by 11AM. The following six layers are currently available: 24-hour, 48-hour and 72-hour total precipitation, as well as maximum 1-hour, 2-hour and 6-hour precipitation over the past 24 hour period (to estimate where flash flooding may have occurred). The 24-hour, 48-hour and 72-hour total precipitation contain bias corrections that are not disaggregated into the hourly estimates, so there will likely be some differences. The accumulation ending time is 7AM of the date shown in the bottom right corner. Also shown optionally are vulnerable fire burn areas (post 2012), which are updated throughout the season to include new, vulnerable burn areas. The home button in the top left corner resets the map to the original zoom.

SPM 06-01-2019: Scattered Afternoon/Evening Showers and a Few Embedded Thunderstorms

Issue Date: Saturday, June 1st, 2019
Issue Time: 9:10 AM MDT

Summary:

Daytime heating and a bit of mid-level moisture acted in concert to drive the development of scattered showers and a few embedded thunderstorms yesterday. Activity kicked off during the late morning hours over the High Country, with eastern Colorado following suit around lunch time. Most of the activity over the High Country was confined to the Front Range, Southeast Mountains, Northern Mountains, Northwest Slope, and Central Mountains, where mid-level moisture was best, relatively speaking. East of the mountains, the Urban Corridor, Northeast Plains, and Palmer Ridge enjoyed scattered showers and a couple thunderstorms, while the Southeast Plains and Raton Ridge remained dry.

Due to a lack of good surface moisture, activity yesterday was high-based, and much of the precipitation that fell evaporated before reaching the surface. This process shunted rain rates and rain totals, and most locations received less than 0.1 inches of rainfall. No flash flooding was reported yesterday. For a look at precipitation estimates in your area, please see the State Precipitation Map below.

Click Here For Map Overview

The map below shows radar-estimated, rainfall gage-adjusted Quantitative Precipitation Estimates (QPE) across Colorado. The map is updated daily during the operational season (May 1 – Sep 30) by 11AM. The following six layers are currently available: 24-hour, 48-hour and 72-hour total precipitation, as well as maximum 1-hour, 2-hour and 6-hour precipitation over the past 24 hour period (to estimate where flash flooding may have occurred). The 24-hour, 48-hour and 72-hour total precipitation contain bias corrections that are not disaggregated into the hourly estimates, so there will likely be some differences. The accumulation ending time is 7AM of the date shown in the bottom right corner. Also shown optionally are vulnerable fire burn areas (post 2012), which are updated throughout the season to include new, vulnerable burn areas. The home button in the top left corner resets the map to the original zoom.

SPM 05-31-2019: Finally, Some Spring Temperatures mixed with Afternoon Storms

Issue Date: Friday, May 31st, 2019
Issue Time: 9:05AM MDT

Summary:

With the ridge building to the northwest, high temperatures yesterday were 5-10F warmer than Wednesday. While still a little below normal, these temperatures were very much appreciated after a cold May. Isolated showers popped up over the high terrain during the afternoon hours favoring the Front Range, San Juan and Southeast Mountains near the Divide. Just over a half inch fell in San Miguel County. Storms were able to survive along the Palmer Ridge as they moved into the adjacent plains, but storms quickly dissipated east of I-25. Radar indicates up to 0.25 inches fell (isolated) with a CoCoRaHS near Fountain reporting 0.08 inches this morning. A passing shortwave over the southern border helped spark more storm activity over the Raton Ridge and Southeast Plains. Radar estimates totals up to 1 inch with max 1-hr rain rates of 0.5 inches.

To see estimated precipitation totals over your area yesterday, scroll down to the State Precipitation Map below.

Click Here For Map Overview

The map below shows radar-estimated, rainfall gage-adjusted Quantitative Precipitation Estimates (QPE) across Colorado. The map is updated daily during the operational season (May 1 – Sep 30) by 11AM. The following six layers are currently available: 24-hour, 48-hour and 72-hour total precipitation, as well as maximum 1-hour, 2-hour and 6-hour precipitation over the past 24 hour period (to estimate where flash flooding may have occurred). The 24-hour, 48-hour and 72-hour total precipitation contain bias corrections that are not disaggregated into the hourly estimates, so there will likely be some differences. The accumulation ending time is 7AM of the date shown in the bottom right corner. Also shown optionally are vulnerable fire burn areas (post 2012), which are updated throughout the season to include new, vulnerable burn areas. The home button in the top left corner resets the map to the original zoom.

SPM 05-30-2019: High Temperatures Drop back Down with Widespread Showers over Northern Colorado

Issue Date: Thursday, May 30th, 2019
Issue Time: 9:25AM MDT

Summary:

A vorticity max slid south over western Colorado yesterday as the low pressure exited the region to the east. In its wake, cool temperatures blanketed the state and kept the plains stable. Scattered storms popped over the mountains during the late morning into the afternoon with diurnal flow. The mid-level energy helped increase coverage of storms causing the eastern Central Mountains and southern Front Range near the Divide to receive the bulk of the precipitation. Radar estimates were generally in the 0.25 to 0.9 inch range with the Hoosier Pass SNOTEL station recording 1 inch. Over 10K feet, precipitation still fell as snow, but accumulations were on the low end. Leadville report 2.1 inches this morning, which is about a 10:1 snow to precipitation ratio. Storms moved into the adjacent plains over the Palmer and Raton Ridges during the late afternoon, but totals were under 0.1 inches with accumulations mostly west of I-25. Activity ended a few hours after sundown, and flooding was not reported.

To see estimated precipitation totals over your area yesterday, scroll down to the State Precipitation Map below.

Click Here For Map Overview

The map below shows radar-estimated, rainfall gage-adjusted Quantitative Precipitation Estimates (QPE) across Colorado. The map is updated daily during the operational season (May 1 – Sep 30) by 11AM. The following six layers are currently available: 24-hour, 48-hour and 72-hour total precipitation, as well as maximum 1-hour, 2-hour and 6-hour precipitation over the past 24 hour period (to estimate where flash flooding may have occurred). The 24-hour, 48-hour and 72-hour total precipitation contain bias corrections that are not disaggregated into the hourly estimates, so there will likely be some differences. The accumulation ending time is 7AM of the date shown in the bottom right corner. Also shown optionally are vulnerable fire burn areas (post 2012), which are updated throughout the season to include new, vulnerable burn areas. The home button in the top left corner resets the map to the original zoom.