Issue Date: Thursday, May 30th, 2019
Issue Time: 9:25AM MDT
Summary:
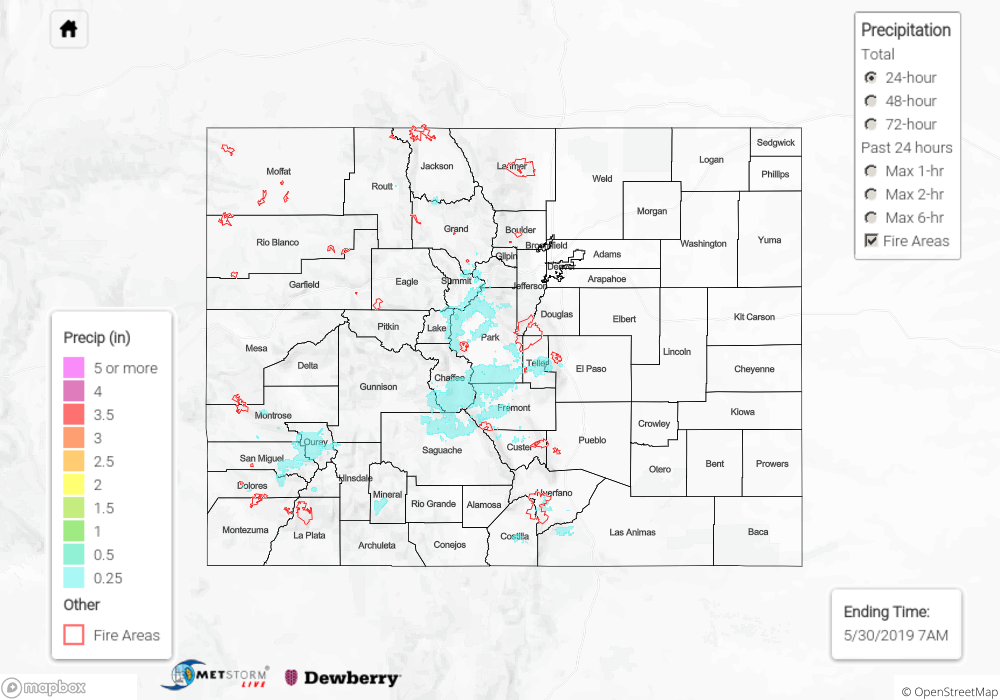
A vorticity max slid south over western Colorado yesterday as the low pressure exited the region to the east. In its wake, cool temperatures blanketed the state and kept the plains stable. Scattered storms popped over the mountains during the late morning into the afternoon with diurnal flow. The mid-level energy helped increase coverage of storms causing the eastern Central Mountains and southern Front Range near the Divide to receive the bulk of the precipitation. Radar estimates were generally in the 0.25 to 0.9 inch range with the Hoosier Pass SNOTEL station recording 1 inch. Over 10K feet, precipitation still fell as snow, but accumulations were on the low end. Leadville report 2.1 inches this morning, which is about a 10:1 snow to precipitation ratio. Storms moved into the adjacent plains over the Palmer and Raton Ridges during the late afternoon, but totals were under 0.1 inches with accumulations mostly west of I-25. Activity ended a few hours after sundown, and flooding was not reported.
To see estimated precipitation totals over your area yesterday, scroll down to the State Precipitation Map below.
Click Here For Map Overview