Issue Date: Sunday, June 2nd, 2019
Issue Time: 9:10 AM MDT
Summary:
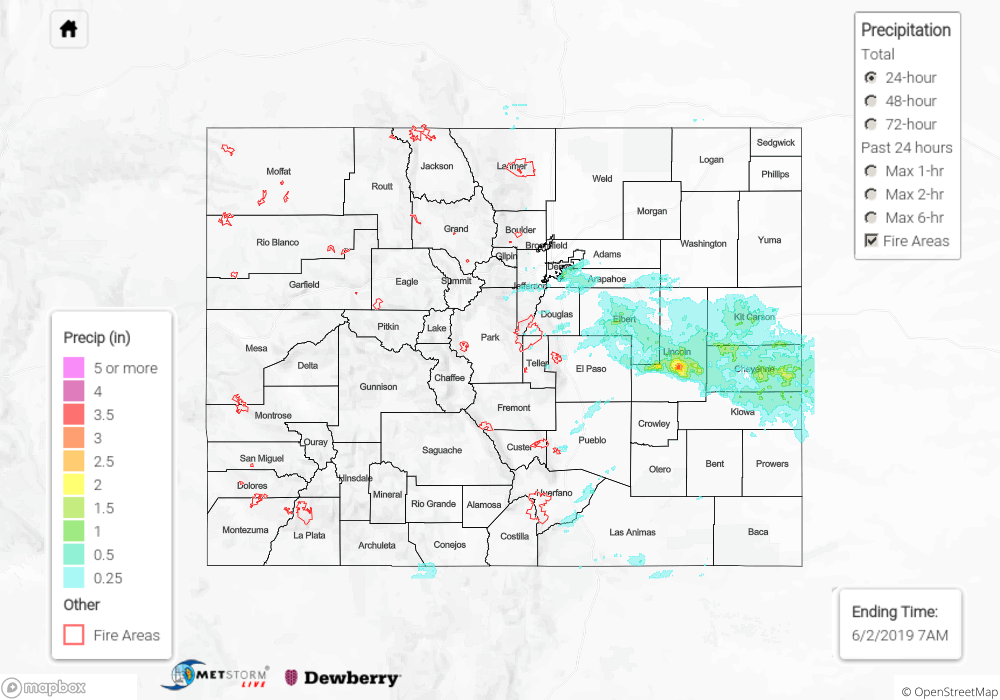
It was the first day of Meteorological Summer yesterday and Mother Nature provided Colorado with a early summer-like day. High pressure ridging built overhead, allowing temperatures to climb a few degrees warmer than Friday. This heating allowed for the development of a few isolated showers/weak thunderstorms west of the Divide, mainly north of I-70, as well as scattered thunderstorms east of the Divide. The storms to the east were fueled by better moisture as easterly upslope flow brought upper 40s/low 50s dewpoints back into the area, resulting in a few strong/severe storms. The main “show” occurred just after 1 PM and continued until about 9 PM across eastern Colorado, but a couple showers/weak thunderstorms occurred over the Palmer Ridge between 11 PM and 3 AM. Large hail was the main severe impact, while heavy rain attended the strongest storms. Severe storm reports submitted to the National Weather Service are as follows:
1.75 inch hail: 4 miles ESE of Foxfield (Arapahoe County)
1.50 inch hail: 3 miles S of Arapahoe Park (Arapahoe County)
1.00 inch hail: 1 mile NNE of Centennial, and 2 miles NW of Aurora where it accumulated to 2 inches deep (Arapahoe County)
Accumulating hail was an issue on some roadways, including CR 105 and Highway 86 (11 miles NNW of Simla) in Elbert county, where hail piled up to 3 inches across the roadway.
No flash flooding was reported yesterday, but a flash flood warning was issued for western Cheyenne County. For a look at precipitation estimates in your area, please see the State Precipitation Map below.
Click Here For Map Overview
The map below shows radar-estimated, rainfall gage-adjusted Quantitative Precipitation Estimates (QPE) across Colorado. The map is updated daily during the operational season (May 1 – Sep 30) by 11AM. The following six layers are currently available: 24-hour, 48-hour and 72-hour total precipitation, as well as maximum 1-hour, 2-hour and 6-hour precipitation over the past 24 hour period (to estimate where flash flooding may have occurred). The 24-hour, 48-hour and 72-hour total precipitation contain bias corrections that are not disaggregated into the hourly estimates, so there will likely be some differences. The accumulation ending time is 7AM of the date shown in the bottom right corner. Also shown optionally are vulnerable fire burn areas (post 2012), which are updated throughout the season to include new, vulnerable burn areas. The home button in the top left corner resets the map to the original zoom.
