Issue Date: Monday, June 10th, 2019
Issue Time: 9:40AM MDT
Summary:
Cool temperatures and a stable air mass yesterday was a nice break from the hot temperatures we’ve been having the last week. Early morning cloud cover over eastern Colorado decreased throughout the day with mostly sunny skies across the state by the late afternoon. 24-hour maximum temperatures can be seen from MesoWest below, which are quite below normal. The overnight lows reached freezing over the Northwest Slope with Denver hitting the 42°F mark early this morning at DIA. Gusty winds were also reported over the Northeast Plains with the passing jet overhead. As for rainfall, only trace amounts were recorded over the Southeast Mountains from the early morning rain, but everywhere else remained dry.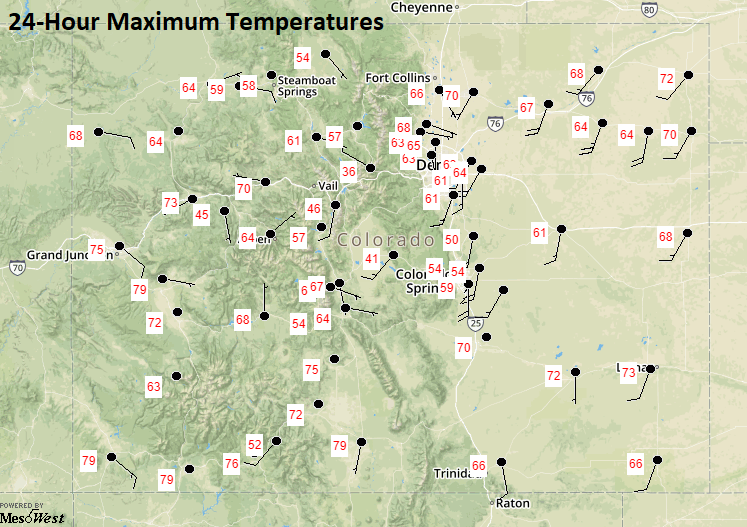
Melting continued for western Colorado, especially southwest Colorado. No new flooding reports were available as of this morning, but the Flood Warning remains for portions of Conejos, Rio Grande and Mineral Counties. This warning addresses the high flows along the San Antonio and Conejos Rivers in southeastern Conejos County as well as for the headwaters of the Rio Grande and San Juan Rivers. Del Norte still experiencing minor flooding. Willow Creek in north central Mineral County also had flooding issues on the south side of town, so the Low threat today was extended into this area. Areal Flood Advisories were issued for the following: Central Hinsdale County above Lake San Cristobal along Williams Creek, Colorado River near the CO/UT state line, Animas River near Durango, San Juan River at Pagosa Springs, La Plata River at Hesperus, Manco River near Mancos and the Gunnison River above Grand Junction. Flow also increased over the Arkansas River west of Pueblo, but no gages reached above Action stage. For the latest warnings and advisories, see today’s FTB post as well as NWS Grand Junction and Pueblo.
AHPS gages (Click Me!) currently at Action or Minor Flooding Stages:
- Tomichi Creek at Gunnison
- Mancos River near Mancos
- La Plata River above Hesperus
- Navajo River near Chromo
- Rio Grande near Del Norte
- Rio Grande at Alamosa
- Gunnison River near Grand Junction
- Colorado River near State Line
- Arkansas River at Wellsville
- Arkansas River at Canon City
- Arkansas River at Avondale (due to dam releases)
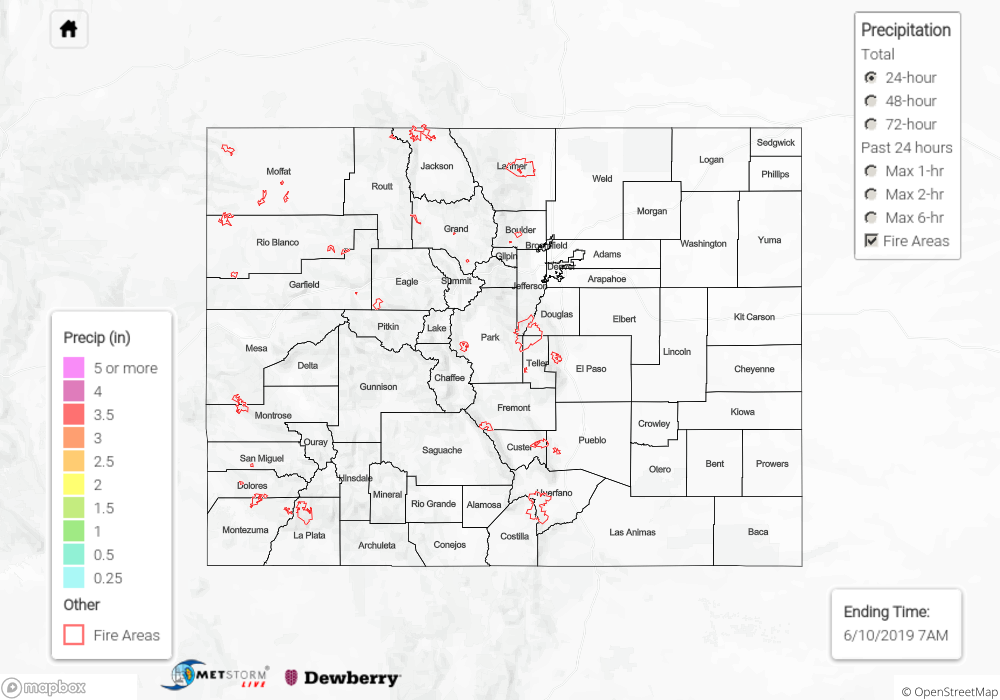
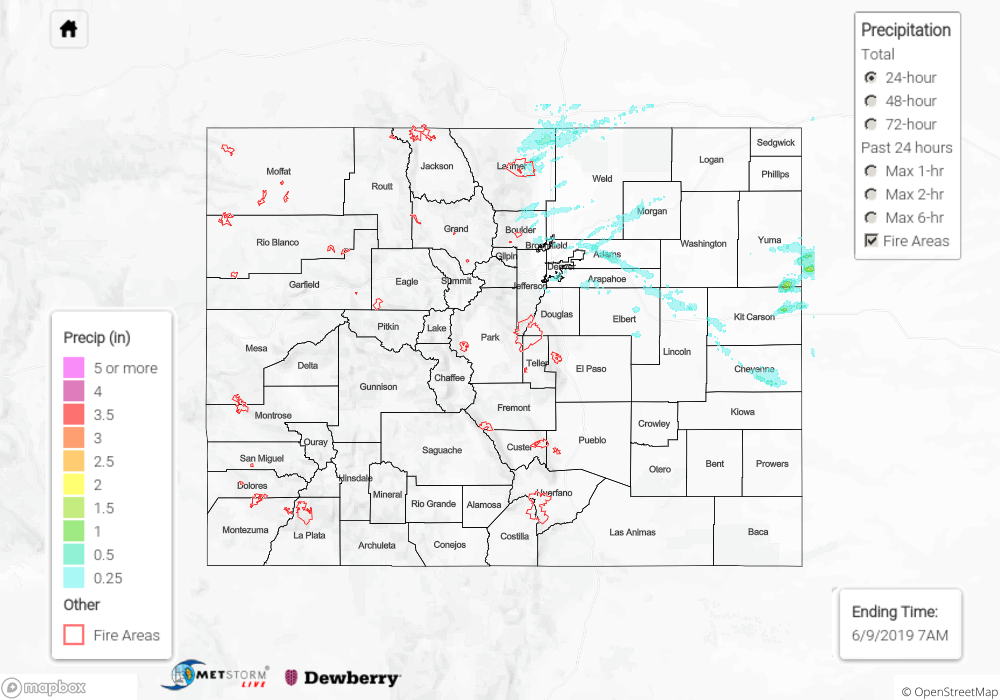
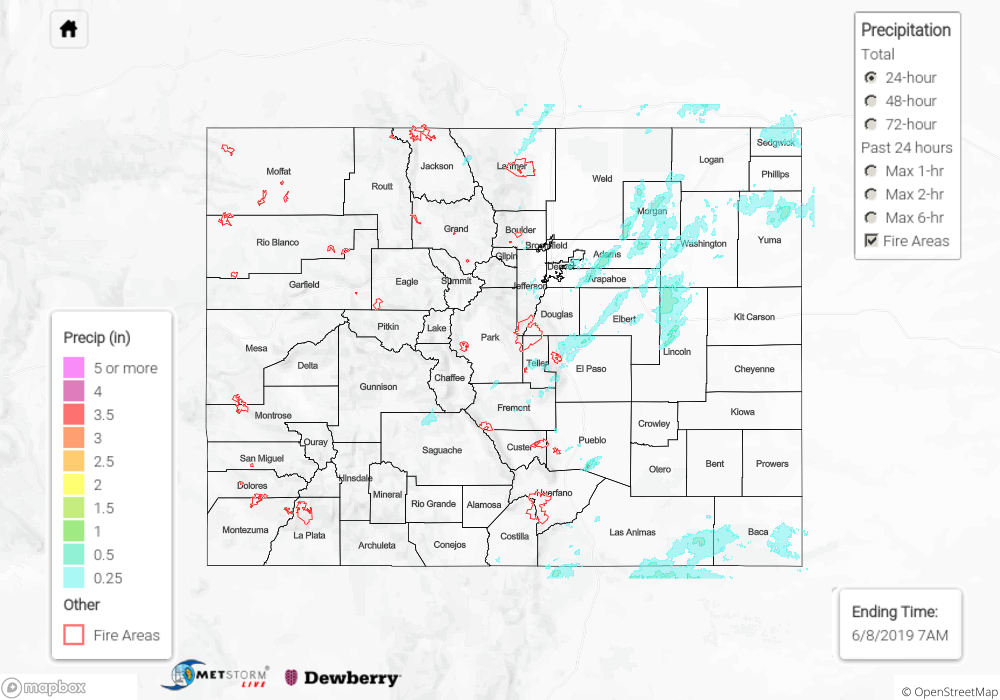
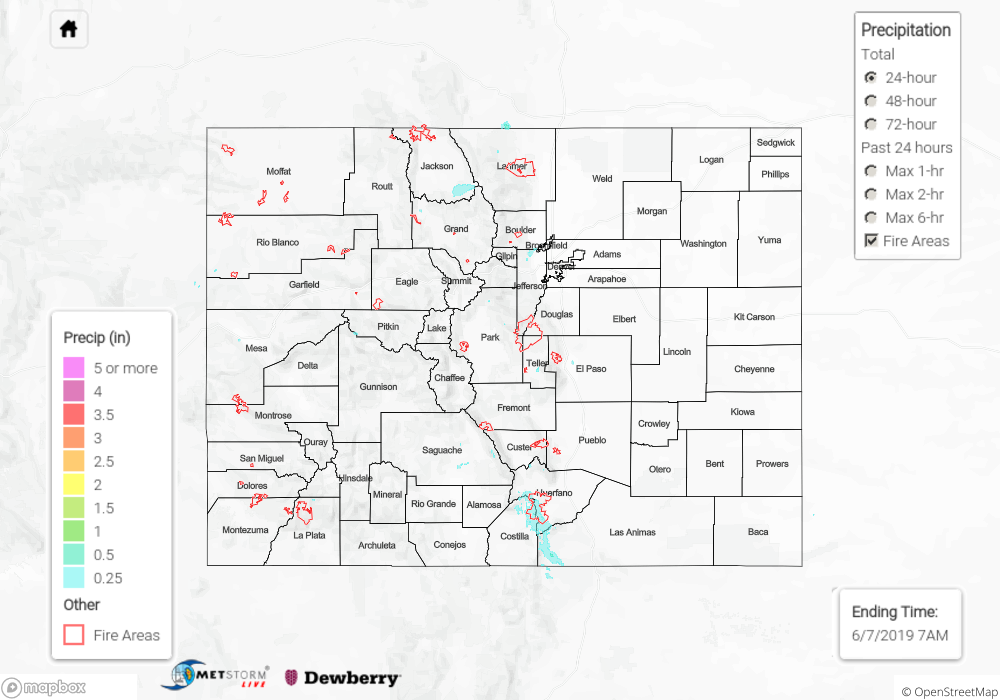
To see estimated precipitation totals over your area yesterday, scroll down to the State Precipitation Map below.
Click Here For Map Overview