Issue Date: Friday, June 7th, 2019
Issue Time: 9:05AM MDT
Summary:
Break in rainfall activity on Thursday as drier air filled in behind the low. With northerly flow and moisture limited to east of the Divide, weak thunderstorms and rainfall were confined to the Front Range and Southeast Mountains. A couple of SNOTEL stations recorded up to 0.3 inches over the Southeast Mountains near the Spring Creek burn area. An Areal Flood Advisory was issued, but flooding was not reported as of this morning. Over northern Jefferson County, a total of 0.5 inches was estimated by radar. Generally, rainfall accumulations were in the 0.1 to 0.3 inch range for the thunderstorms yesterday afternoon and evening. Flooding was not reported.
Temperatures hit the 90°F mark over the Grand Valley yesterday with highs in the upper 80°Fs for the eastern plains. With the mountain areas reaching at least the mid-50°Fs with the lower valleys in the upper 60°Fs and 70°Fs, snowmelt continued. A Flood Warning for the San Antonio and Conejos Rivers in southeastern Conejos County runs through Monday morning. The Areal Flood Advisories also persisted for the Gunnison River above Grand Junction, the La Plata River at Hesperus and for the Mancos River in Montezuma County for minor lowland flooding. These advisories continue until further notice by the NWS. Minor flooding was not reported at any of these locations, though rivers remain at or slightly above bankfull.
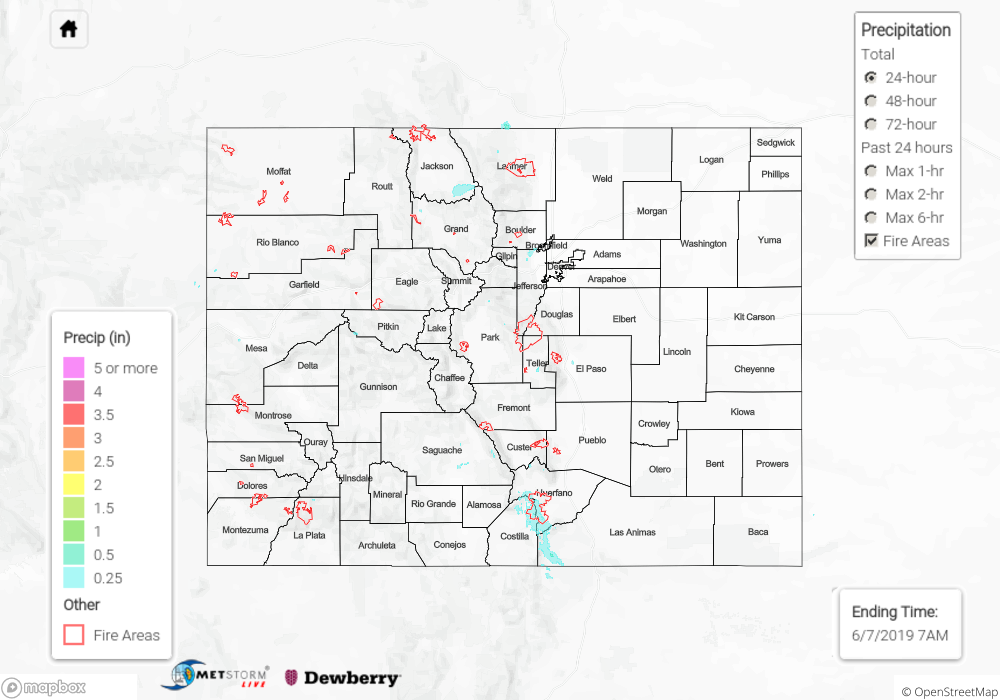
To see estimated precipitation totals over your area yesterday, scroll down to the State Precipitation Map below.
Click Here For Map Overview