SPM 06-18-2019: Active Day Across Colorado with Heavy Rain, Flash Flooding, Hail, Wind, and a Tornado over the Eastern Plains

Issue Date: Tuesday, June 18th, 2018
Issue Time: 10:35 AM MDT

Summary:

Few areas of the state remained dry yesterday as a shortwave passed over the state, helping spark numerous showers and thunderstorms.  A surface low on the central eastern plains helped pull in some high moisture values for heavy rainfall under slow steering winds.  A break in the clouds by mid-morning allowed for surface heating and convective instability to build, which helped produced several severe thunderstorms over the Grand Valley, Southeast Plains, Northeast Plains and Urban Corridor. A severe storm near Chivington in Kiowa County produced flash flooding (causing parts of Colorado 96 to wash out), a weak tornado and 1.75 inch hail. Radar estimates up to 4 inches of rain fell in Kit Carson County over a 2-hour period, which is a 1 in 200 year event.

Multiple hail reports were recorded in Pueblo County, with the largest hail recorded at 2.5 inches. Weak upper level winds allowed the storms to linger within the area, resulting in a rain report of 2.25 inches and winds up to 69 mph at Pueblo Memorial Airport.  Glade Park in Mesa County recorded 0.75 inches of rain. Storms yesterday also produced a lot of wind. A gust of 70 mph caused downed power-lines in Baca and a gust of 62 mph was recorded over Boulder County associated with a storm in the area. For the storm in Boulder, the UDFCD ALERT network recorded an inch of rain in 30 minutes. As of this morning, there were no flood reports with this storm.

As far as riverine flooding, gages remain high over the Arkansas River downstream of Pueblo Dam. The Nepesta gage temporarily dropped below Action stage, but has returned this morning. There was also an increase in flow at the La Junta gauge. Over the southwest, there were reports by emergency management of minor flooding issues along the headwaters of the Rio Grande and in central Saguache County. This will continued to be monitored in the daily FTB.

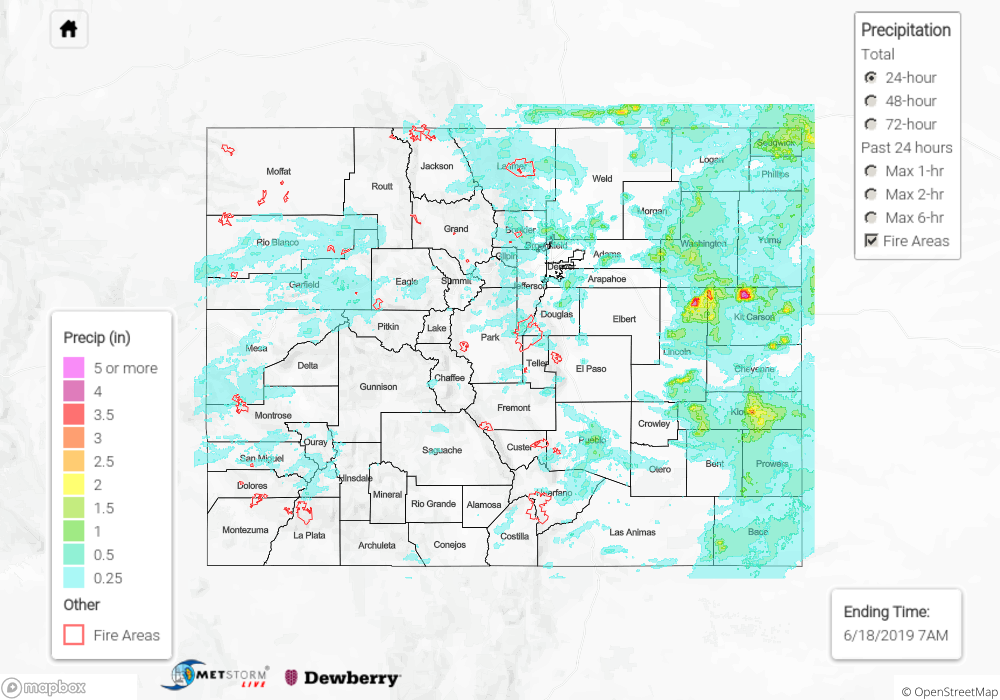
For a look at yesterday’s widespread precipitation, please see our State Precipitation Map below.

Click Here For Map Overview

The map below shows radar-estimated, rainfall gage-adjusted Quantitative Precipitation Estimates (QPE) across Colorado. The map is updated daily during the operational season (May 1 – Sep 30) by 11AM. The following six layers are currently available: 24-hour, 48-hour and 72-hour total precipitation, as well as maximum 1-hour, 2-hour and 6-hour precipitation over the past 24 hour period (to estimate where flash flooding may have occurred). The 24-hour, 48-hour and 72-hour total precipitation contain bias corrections that are not disaggregated into the hourly estimates, so there will likely be some differences. The accumulation ending time is 7AM of the date shown in the bottom right corner. Also shown optionally are vulnerable fire burn areas (post 2012), which are updated throughout the season to include new, vulnerable burn areas. The home button in the top left corner resets the map to the original zoom.

SPM 06-17-2019: Heavy Rainfall and Hail Along the Palmer Ridge and Northeast Plains

Issue Date: Monday, June 17th, 2019
Issue Time: 10:55 AM MDT

Summary:

Rain continued yesterday throughout the high country and eastern planes as ample moisture present from Saturday’s storms combined with sunny morning skies to produce instability and thunderstorms.  Convection began mid-morning over the high country, but was limited to less than 0.25 inches as upper level support limited storm strength and severity.  Light upper level winds perturbed storm motion allowing for heavy rainfall rates throughout the state. Higher rainfall amounts of up to 0.54 inches were measured by CoCoRaHS in southern Jefferson County and Douglas County beginning around noon.  The heaviest precipitation occurred at the intersection of the Urban Corridor and Palmer Ridge, with a report by the NWS Pueblo of 2.28 inches.  Ground precipitation measurements in El Paso County were likely contaminated by hail, but flash flooding was reported to the NWS near Colorado Springs with water covering the road at Quail Lake Road.  The river gauge briefly reached action stage during the event.  Hail up to 1 inch diameter was measured within the storm.  The far corner of the Northeast Plains received widespread heavy rainfall up to 1.5 inches beginning mid-afternoon and ending early this morning.  1.5 inch diameter hail was reported near Fort Saint Vrain in Weld County.  West of the continental divide rainfall remained less than 0.2 inches, favoring the Central and San Juan Mountains, as convection was isolated and weak.

Flooding also continued along the Arkansas River near Avondale downstream from Pueblo due snowmelt and recent releases. The gauge continues to be in Minor Flood stage this morning.

For a look at precipitation estimates in your area, please see the State Precipitation Map below.

Click Here For Map Overview

The map below shows radar-estimated, rainfall gage-adjusted Quantitative Precipitation Estimates (QPE) across Colorado. The map is updated daily during the operational season (May 1 – Sep 30) by 11AM. The following six layers are currently available: 24-hour, 48-hour and 72-hour total precipitation, as well as maximum 1-hour, 2-hour and 6-hour precipitation over the past 24 hour period (to estimate where flash flooding may have occurred). The 24-hour, 48-hour and 72-hour total precipitation contain bias corrections that are not disaggregated into the hourly estimates, so there will likely be some differences. The accumulation ending time is 7AM of the date shown in the bottom right corner. Also shown optionally are vulnerable fire burn areas (post 2012), which are updated throughout the season to include new, vulnerable burn areas. The home button in the top left corner resets the map to the original zoom.

SPM 06-16-2019: Uptick in Storm Coverage, Most were Garden Variety

Issue Date: Sunday, June 16th, 2019
Issue Time: 9:10 AM MDT

Summary:

An upper-level disturbance shifting across the southern/central Rockies yesterday provided broad support for scattered showers and thunderstorms across Colorado. Most of the storms were garden variety, producing periods of moderate rainfall and gusty winds. A few, however, were strong over the Southeast Mountains, Southeast Plains, and Raton Ridge regions, where better moisture/instability fueled their greater relative intensity. These stronger storms produced periods of heavy rainfall, strong winds, and small hail. One report of wind damage was received: 6-inch diameter tree branches were blown down in Cheraw (Otero County). Most activity came to an end by 10 PM, with a broad shower/thunderstorm complex over the far Southeast Plains continuing into the early hours this morning.

No flash flooding was reported yesterday, although heavy rainfall did fall over the Junkins burn scar, prompting the issuance of a flash flood warning. For a look at precipitation estimates in your area, please see the State Precipitation Map below.

Click Here For Map Overview

The map below shows radar-estimated, rainfall gage-adjusted Quantitative Precipitation Estimates (QPE) across Colorado. The map is updated daily during the operational season (May 1 – Sep 30) by 11AM. The following six layers are currently available: 24-hour, 48-hour and 72-hour total precipitation, as well as maximum 1-hour, 2-hour and 6-hour precipitation over the past 24 hour period (to estimate where flash flooding may have occurred). The 24-hour, 48-hour and 72-hour total precipitation contain bias corrections that are not disaggregated into the hourly estimates, so there will likely be some differences. The accumulation ending time is 7AM of the date shown in the bottom right corner. Also shown optionally are vulnerable fire burn areas (post 2012), which are updated throughout the season to include new, vulnerable burn areas. The home button in the top left corner resets the map to the original zoom.

SPM 06-15-2019: Disturbance Aloft Helped Kick Off Scattered Thunderstorms

Issue Date: Saturday, June 15th, 2019
Issue Time: 9:10 AM MDT

Summary:

A broad disturbance aloft, coupled with daytime heating and orographic support, triggered scattered thunderstorms across much of the state yesterday. The heaviest rain, relatively speaking, occurred east of the mountains where better low-level moisture was available. Brief instances of street/field ponding likely occurred under the strongest storms, but no flooding was realized thanks to relatively quick storm motions. Over the High Country, moisture was more limited, so the main result was periods of light-to-moderate rainfall and gusty winds; however, a few stronger storms did produce small hail over Routt County, as well as a severe wind gust in Garfield County. The Southwest Slope, San Juan Mountains, and San Luis Valley largely stayed out of the shower/thunderstorm activity due to lack of moisture and upper-level support.

The following severe thunderstorm reports were submitted to the National Weather Service:
1.75 inch diameter hail: Two Buttes (Baca County)
62 mph Thunderstorm Wind Gust: Douglas Pass (Garfield County)
61 mph Thunderstorm Wind Gust: 3 miles NW of Fruitvale (Mesa County)
60 mph Thunderstorm Wind Gust: Cheyenne Wells (Cheyenne County)

No flash flooding was reported yesterday. For a look at precipitation estimates in your area, please see the State Precipitation Map below.

Click Here For Map Overview

The map below shows radar-estimated, rainfall gage-adjusted Quantitative Precipitation Estimates (QPE) across Colorado. The map is updated daily during the operational season (May 1 – Sep 30) by 11AM. The following six layers are currently available: 24-hour, 48-hour and 72-hour total precipitation, as well as maximum 1-hour, 2-hour and 6-hour precipitation over the past 24 hour period (to estimate where flash flooding may have occurred). The 24-hour, 48-hour and 72-hour total precipitation contain bias corrections that are not disaggregated into the hourly estimates, so there will likely be some differences. The accumulation ending time is 7AM of the date shown in the bottom right corner. Also shown optionally are vulnerable fire burn areas (post 2012), which are updated throughout the season to include new, vulnerable burn areas. The home button in the top left corner resets the map to the original zoom.