Issue Date: Monday, June 17th, 2019
Issue Time: 10:55 AM MDT
Summary:
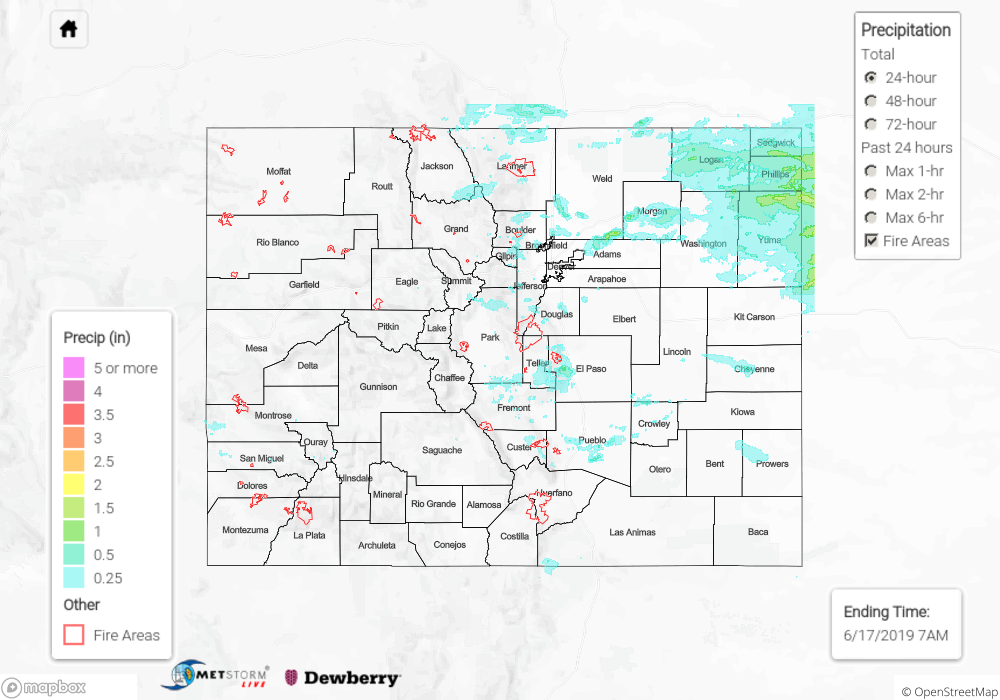
Rain continued yesterday throughout the high country and eastern planes as ample moisture present from Saturday’s storms combined with sunny morning skies to produce instability and thunderstorms. Convection began mid-morning over the high country, but was limited to less than 0.25 inches as upper level support limited storm strength and severity. Light upper level winds perturbed storm motion allowing for heavy rainfall rates throughout the state. Higher rainfall amounts of up to 0.54 inches were measured by CoCoRaHS in southern Jefferson County and Douglas County beginning around noon. The heaviest precipitation occurred at the intersection of the Urban Corridor and Palmer Ridge, with a report by the NWS Pueblo of 2.28 inches. Ground precipitation measurements in El Paso County were likely contaminated by hail, but flash flooding was reported to the NWS near Colorado Springs with water covering the road at Quail Lake Road. The river gauge briefly reached action stage during the event. Hail up to 1 inch diameter was measured within the storm. The far corner of the Northeast Plains received widespread heavy rainfall up to 1.5 inches beginning mid-afternoon and ending early this morning. 1.5 inch diameter hail was reported near Fort Saint Vrain in Weld County. West of the continental divide rainfall remained less than 0.2 inches, favoring the Central and San Juan Mountains, as convection was isolated and weak.
Flooding also continued along the Arkansas River near Avondale downstream from Pueblo due snowmelt and recent releases. The gauge continues to be in Minor Flood stage this morning.
For a look at precipitation estimates in your area, please see the State Precipitation Map below.
Click Here For Map Overview