Issue Date: Saturday, June 15th, 2019
Issue Time: 9:10 AM MDT
Summary:
A broad disturbance aloft, coupled with daytime heating and orographic support, triggered scattered thunderstorms across much of the state yesterday. The heaviest rain, relatively speaking, occurred east of the mountains where better low-level moisture was available. Brief instances of street/field ponding likely occurred under the strongest storms, but no flooding was realized thanks to relatively quick storm motions. Over the High Country, moisture was more limited, so the main result was periods of light-to-moderate rainfall and gusty winds; however, a few stronger storms did produce small hail over Routt County, as well as a severe wind gust in Garfield County. The Southwest Slope, San Juan Mountains, and San Luis Valley largely stayed out of the shower/thunderstorm activity due to lack of moisture and upper-level support.
The following severe thunderstorm reports were submitted to the National Weather Service:
1.75 inch diameter hail: Two Buttes (Baca County)
62 mph Thunderstorm Wind Gust: Douglas Pass (Garfield County)
61 mph Thunderstorm Wind Gust: 3 miles NW of Fruitvale (Mesa County)
60 mph Thunderstorm Wind Gust: Cheyenne Wells (Cheyenne County)
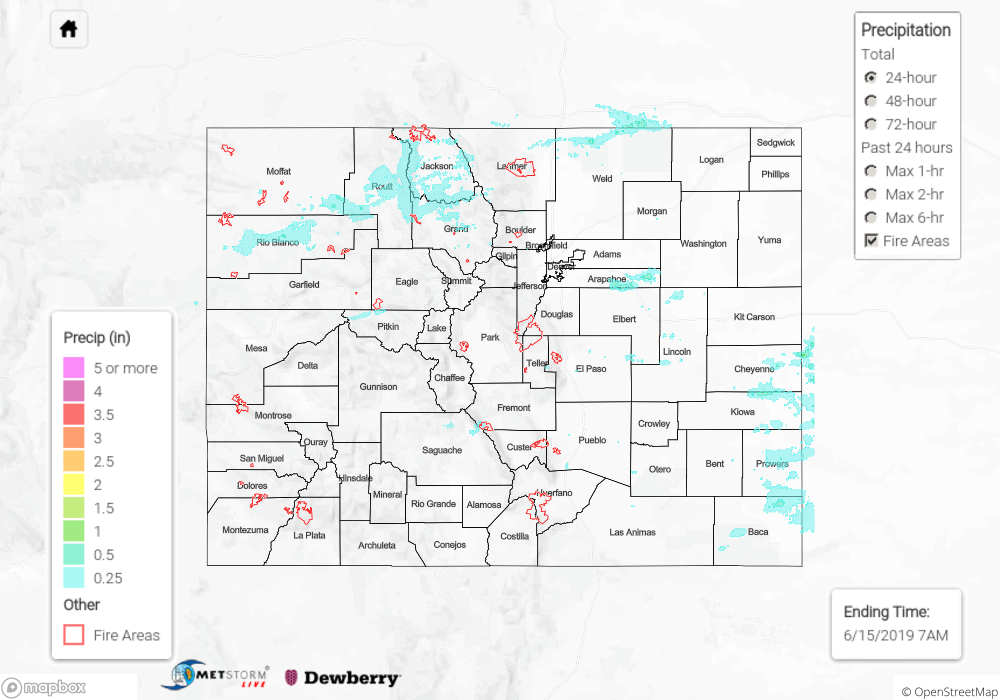
No flash flooding was reported yesterday. For a look at precipitation estimates in your area, please see the State Precipitation Map below.
Click Here For Map Overview
The map below shows radar-estimated, rainfall gage-adjusted Quantitative Precipitation Estimates (QPE) across Colorado. The map is updated daily during the operational season (May 1 – Sep 30) by 11AM. The following six layers are currently available: 24-hour, 48-hour and 72-hour total precipitation, as well as maximum 1-hour, 2-hour and 6-hour precipitation over the past 24 hour period (to estimate where flash flooding may have occurred). The 24-hour, 48-hour and 72-hour total precipitation contain bias corrections that are not disaggregated into the hourly estimates, so there will likely be some differences. The accumulation ending time is 7AM of the date shown in the bottom right corner. Also shown optionally are vulnerable fire burn areas (post 2012), which are updated throughout the season to include new, vulnerable burn areas. The home button in the top left corner resets the map to the original zoom.