Issue date: Wednesday, June 26th, 2019
Issue Time: 10:30 AM MDT
Summary:
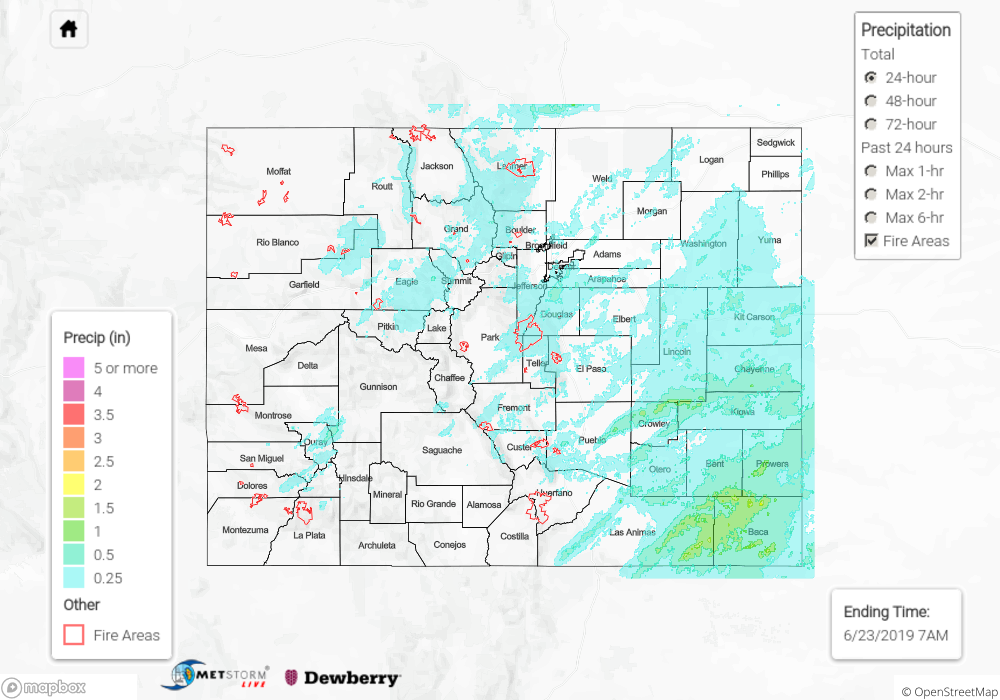
Calm conditions and clear skies yesterday as an upper level ridge set in over the region. A weak shortwave passed over central Colorado during the early afternoon and helped provide lift for brief midday showers over the northwest quadrant as well as the North, Central and San Juan Mountains. Radar derived rainfall estimated less than 0.25 inches over most of these areas. Pockets of short duration, isolated, rainfall of up to 0.3 inches in 1-hour occurred over the Urban Corridor, Palmer Ridge and the southernmost portion of the Northeast Plains. Once again, dry air below the high cloud base prompted gusty winds. Buckley Air Force Base reported a gust of 33 mph at 2 PM.
Other than the isolated showers, the day was full of sunny skies and seasonal temperatures. High temperatures reached 95°F over the Southeast Plains, 90°F over the Grand Valley, and into the low 80°Fs in the valleys of the high country. Rain cooled air and cloud cover prevented temperatures at DIA from reaching 90°F. Thus, the record for the latest day a high temperature to reach 90°F was broken (since 1995).
Waters retreated from Action stage along the North Platte River near Northgate and the Arkansas River near Avondale. Gages remain in Action stage on the Rio Grande River near Alamosa and the Arkansas River at La Junta, but flows are decreasing. No Flooding was reported yesterday.
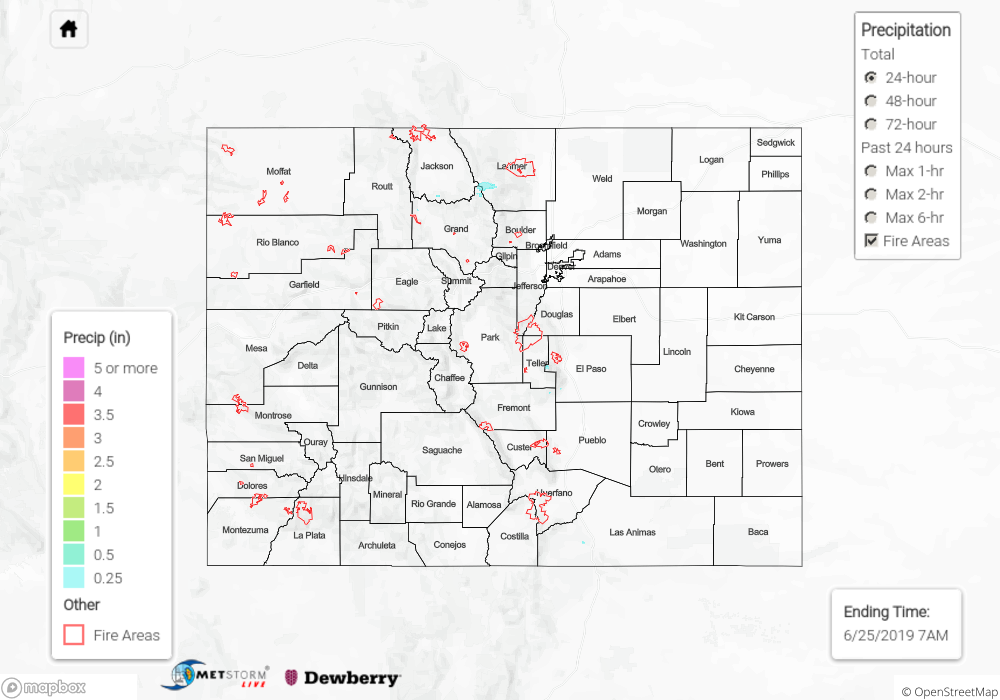
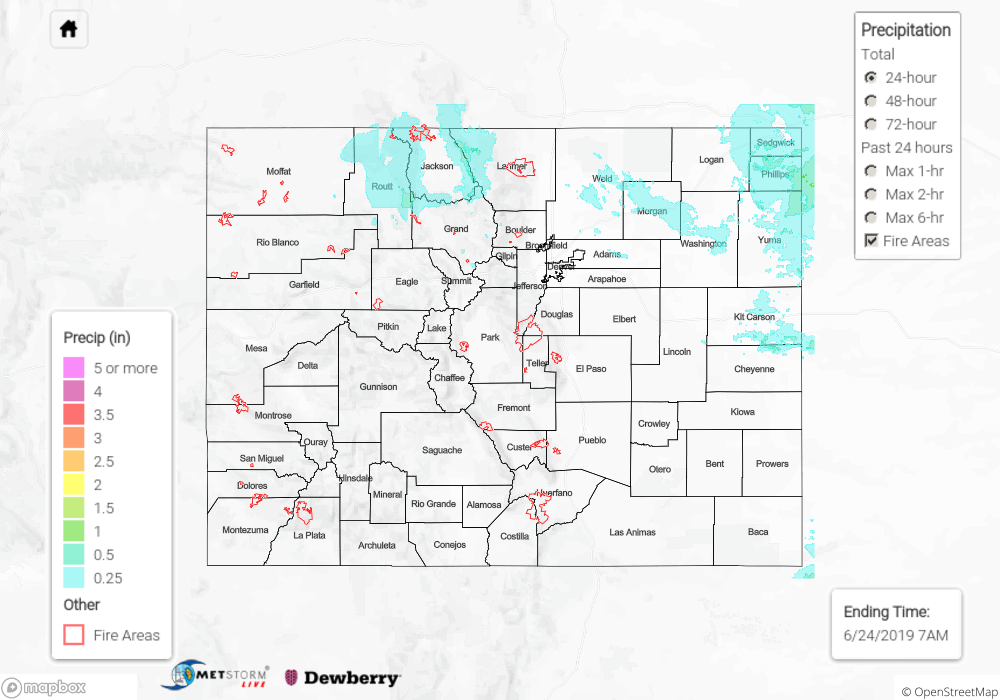
For a look at precipitation estimates in your area, please see the State Precipitation Map below.
Click Here For Map Overview