Issue Date: Tuesday, June 25th, 2019
Issue Time: 9:30 AM MDT
Summary:
High pressure and sunny skies dominated most of the state’s weather yesterday, providing a break from unseasonably cool temperatures and persistent rainfall. Isolated, weak showers began over the Northern Mountains early in the evening as a surface low to the north provided upslope flow. Radar derived estimates of rainfall up to 0.3 inches over Rocky Mountain National Park in Larimer County. Additional isolated showers were present over the Northeast Plains and Central Mountains, with similar 1-hour accumulations. Precipitation at the surface remained light, as dry air underneath the cloud base caused much of the rain to evaporate before reaching the surface. This is confirmed statewide, as surface reports from CoCoRaHS, SNOTEL, and ASOS stations often reported accumulations less than 50% of the radar estimates. Many wind gusts were reported by ASOS stations underneath the virga, with the Northern Colorado Regional Airport reporting gusts up to 38 mph.
Minor flood stage was recorded on the Arkansas River at Avondale during the day, but waters retreated to Action stage overnight. Gages remain at Action stage on the Arkansas at La Junta, the Rio Grande at Alamosa, and the North Platte near Northgate.
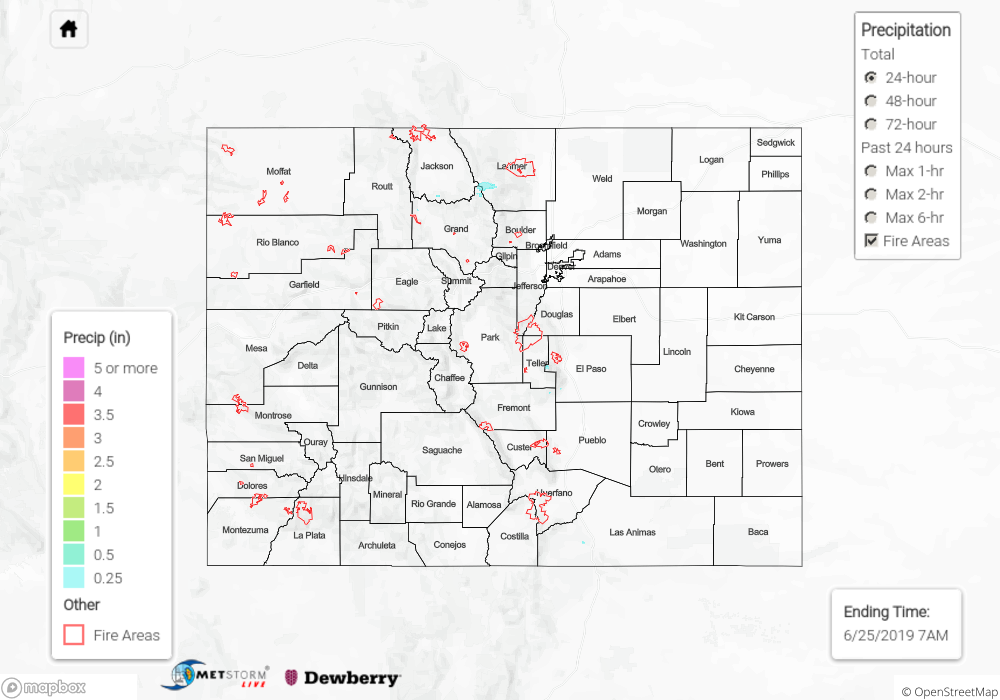
For a look at precipitation estimates in your area, please see the State Precipitation Map below.
Click Here For Map Overview