Issue Date: Sunday, June 23rd, 2019
Issue Time: 9:10 AM MDT
Summary:
Yesterday was unsettled day across Colorado from start to finish, thanks to the combined effects of a seasonally strong upper-level low, plenty of moisture, and enough daytime heating. Showers and thunderstorms began to pick up steam just after Noon, eventually becoming widespread across much of Colorado during the late afternoon and evening hours. The heaviest rain fell east of the mountains, and resulted in some ponding issues on roadways and parking lots, but no flash flooding was experienced. Over the mountains, the strongest storms produced mainly pea-sized to dime-sized hail (accumulating in some locations), and periods of moderate rainfall. Snow fell above 9,000-10,000 feet, with a few locations receiving fairly substantial snowfall amounts over the past 48 hours or so, especially in the Northern Mountains region. A few storms did reach severe thresholds; here are the reports submitted to the National Weather Service:
2.00 inch hail: 5 miles NNW of Campo (Baca County), 10 miles SSE of Higbee (Las Animas County)
1.75 inch hail: Two Buttes (Baca County)
1.00 inch hail: 1 mile N of Campo (Baca County), Cimarron (Montrose County)
58 mph Thunderstorm Wind Gust: 9 miles S of Springfield (Baca County)
Tornado: 18 miles N of Pritchett
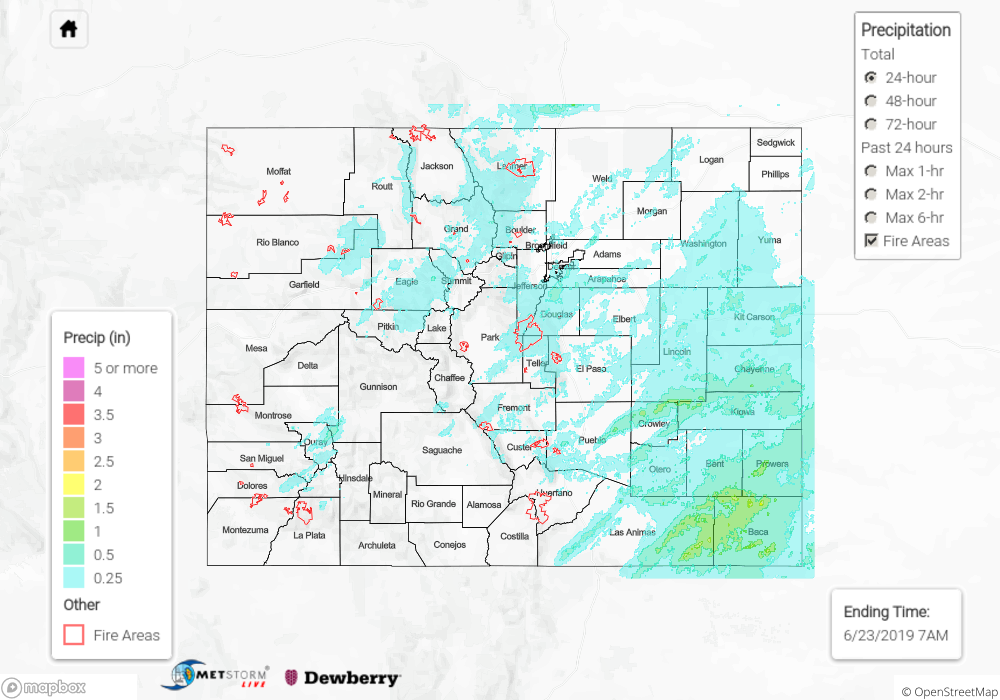
A few isolated pockets of rain showers and high elevation snow continued until after sunrise this morning. For a look at precipitation estimates in your area, please see the State Precipitation Map below.
Click Here For Map Overview
The map below shows radar-estimated, rainfall gage-adjusted Quantitative Precipitation Estimates (QPE) across Colorado. The map is updated daily during the operational season (May 1 – Sep 30) by 11AM. The following six layers are currently available: 24-hour, 48-hour and 72-hour total precipitation, as well as maximum 1-hour, 2-hour and 6-hour precipitation over the past 24 hour period (to estimate where flash flooding may have occurred). The 24-hour, 48-hour and 72-hour total precipitation contain bias corrections that are not disaggregated into the hourly estimates, so there will likely be some differences. The accumulation ending time is 7AM of the date shown in the bottom right corner. Also shown optionally are vulnerable fire burn areas (post 2012), which are updated throughout the season to include new, vulnerable burn areas. The home button in the top left corner resets the map to the original zoom.