Issue Date: Wednesday, August 21st, 2019
Issue Time: 10:57AM MDT
Summary:
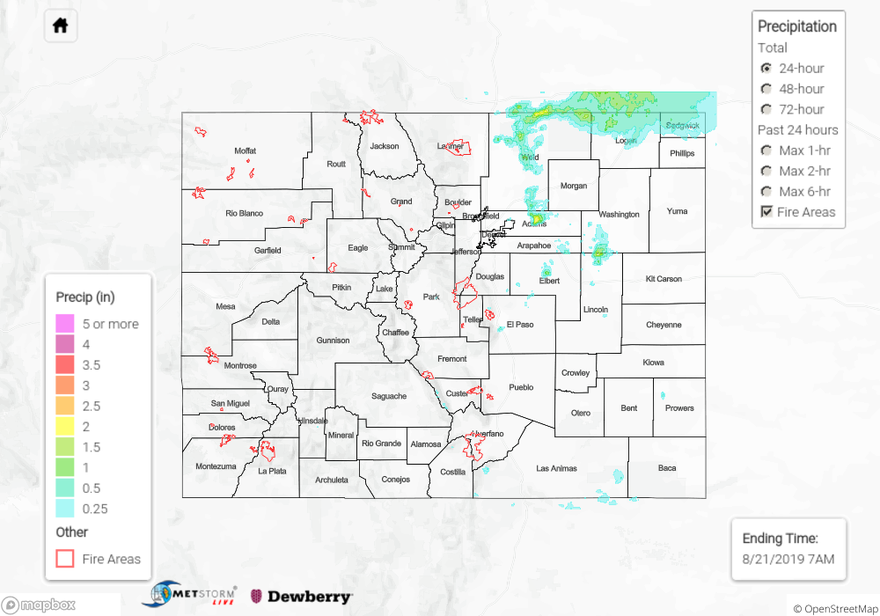
It was a very active day yesterday over the Northeast Plains with multiple reports of hail and some isolated areas of heavy rain. Strong upslope flow of moist air from Nebraska and Kansas combined with a passing shortwave around the time of peak heating to create multiple supercells over the Northeast Plains, northern Urban Corridor and eastern Palmer Ridge. Post frontal upslope flow then generated some weak thunderstorms throughout Urban Corridor, which gained strength as they moved east. Hail ranged in size from north to south across Weld County and down into Adams County from 1.75 inches to 1 inch. Heavy rainfall also increased to the east, though it was rather isolated in nature. Nearly stationary storms helped produce the high totals. Radar derived rainfall rates just below 2.5 inches in 1 hour over central Adams County and up to 2.08 inches in northern Weld County. Due to the isolated nature of the rain, surface stations did not pick up as much rain due to sparseness in location. However, a COOP station in northeast Weld County reported 1.18 inches of rain in an hour long period. Flooding was not reported as of this morning, although there was a Flash Flood Warning for central Adams County at 7:10PM last night.
Rainfall across the foothills and Urban Corridor last night was light, with CoCoRaHS reports below 0.1 inches. There were some gusty outflow winds, which kicked up a lot of dust during the early evening hours across the metro area. A cold front also passed over the area early last night, which rapidly increased cloud cover over and produced multiple some additional areas of lighter rainfall over the far northeast corner. The cap wasn’t fully broken near the CO/NE border, so totals weren’t as high as forecast over this area.
There were a few light showers over eastern San Juan Mountains and the Northern Mountains yesterday afternoon, but surface reports indicated only trace amounts of rainfall. There were likely some gusty winds as well. Insufficient moisture prevented storm generation over the area. High temperatures reached up to 107 degrees over the Grand Valley with temperatures in the upper 80°Fs and 90°Fs throughout the high country. There were also very hot temperatures this last week over the Southeast Plains, which is uncommon for this time of year. Hopefully, we’ll get that taste of fall next week.
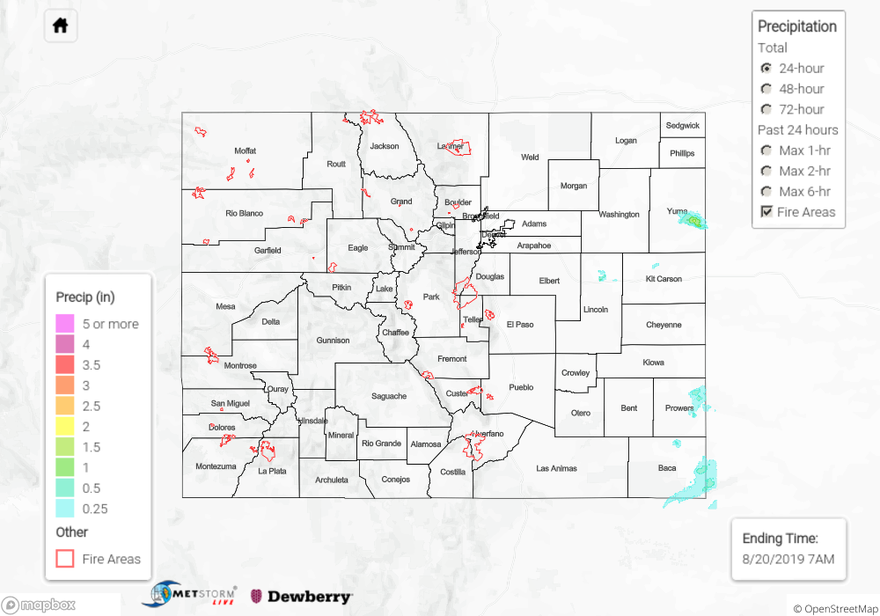
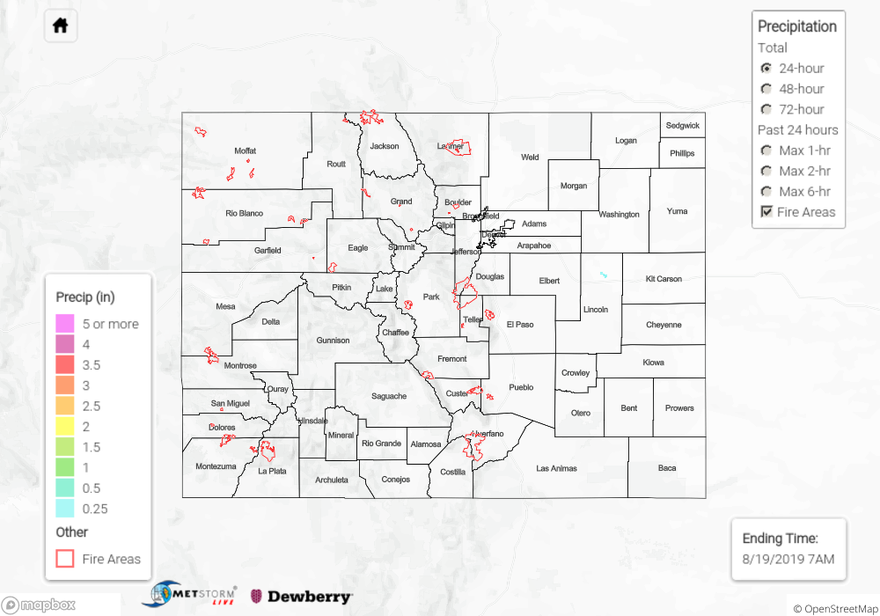
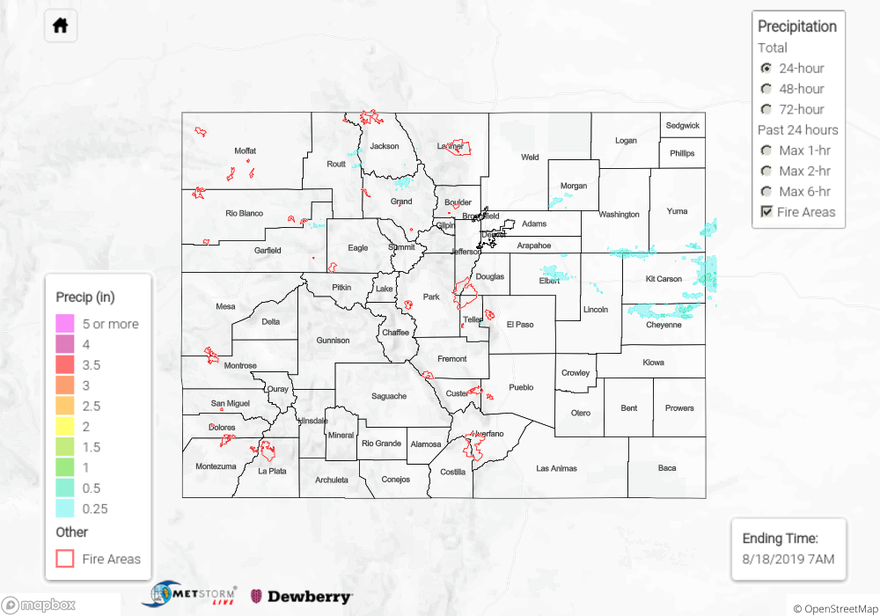
For a look at precipitation over your area, please visit the State Precipitation Map below.
Click Here For Map Overview