Issue Date: Tuesday, August 20, 2019
Issue Time: 10:50AM MDT
Summary:
Yesterday was mostly hot and dry with multiple high temperature records broken over the eastern plains. Denver International Airport broke a high temperature record of 97°F set back in 1986 with a high of 99°F yesterday. Airports in Boulder, Limon, Centennial and CSU in Fort Collins also broke their high temperature records. As far as rainfall goes, almost all of the state remained dry except for Yuma, Prowers and Baca Counties. Isolated severe thunderstorms began yesterday around the time of peak heating along the dryline. The strongest storm of the day was over Yuma County (near Vernon) where there were three reports of hail ranging in size from pennies to golf balls. Radar derived up to 1.97 inches of rain in 1 hour within the storm over Yuma County, however this total may be inflated due to hail contamination. Flooding was not reported as of this morning. Surface reports are sparse over these areas, however a COOP station near Holly in Prowers County reported 0.8 inches of rain over a 45 minute period around 4PM yesterday. There were no reports of rain elsewhere and relative humidity dropped into the teens and single digits throughout western Colorado once again. The area with higher surface winds (15-20 mph) and low relativity humidity wasn’t large enough or persistent enough for a Red Flag Warning to be issued.
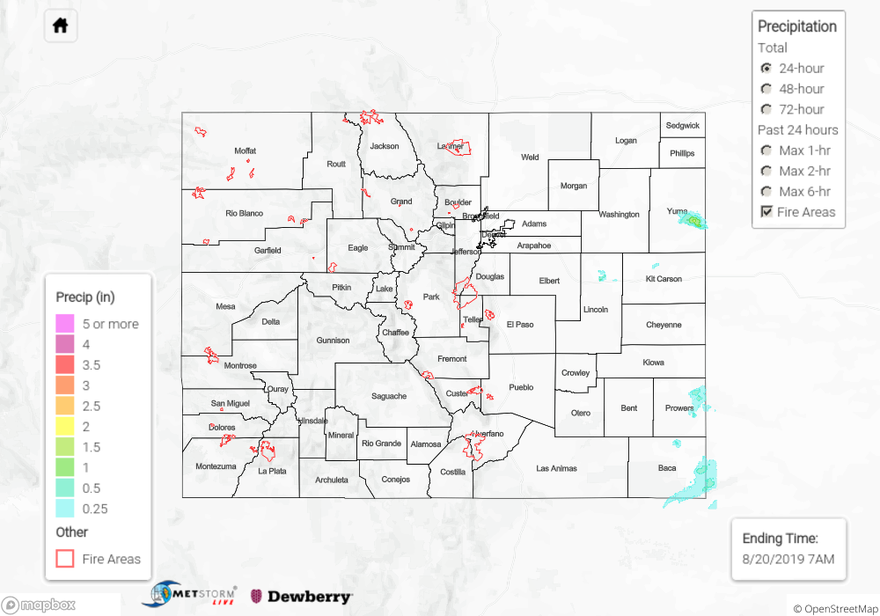
For a look at precipitation over your area, please visit the State Precipitation Map below.
Click Here For Map Overview