Issue Date: Monday, September 2nd, 2019
Issue Time: 9:10 AM MDT
Summary:
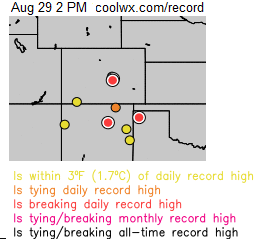
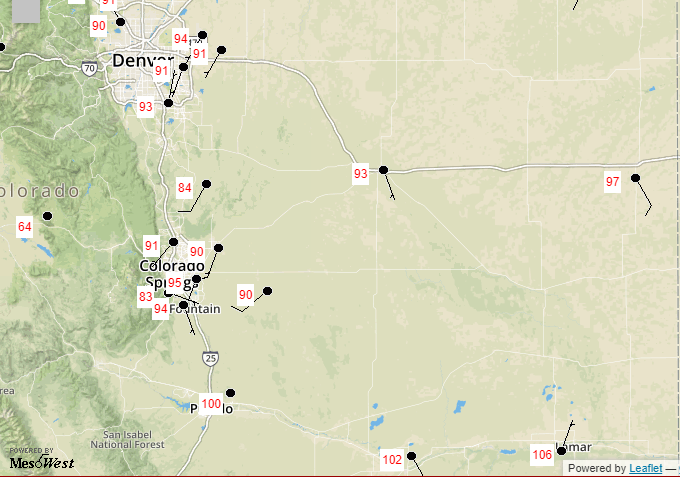
Strong high pressure allowed for abundant sunshine to heat Colorado yesterday, setting record highs across the state. Denver (98°F), Boulder (98°F), Alamosa (87°F), Colorado Springs (95°F), Pueblo (101°F), and Grand Junction (100°F) all set record high temperatures for the date. In fact, Denver’s record high temperature set a new record for the entire month of September. With the extreme heat came a few isolated thunderstorms, mainly over the higher terrain of the San Juan and Southeast Mountains, that produced very little (if any) rainfall at the surface. Weak surface convergence over the eastern plains resulted in a little extra cloud cover, but there was not enough forcing for thunderstorm development.
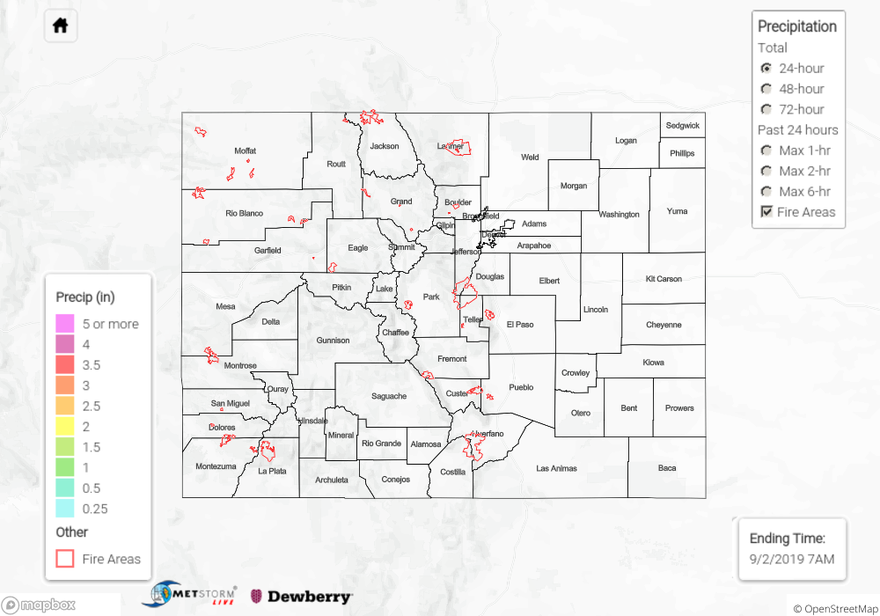
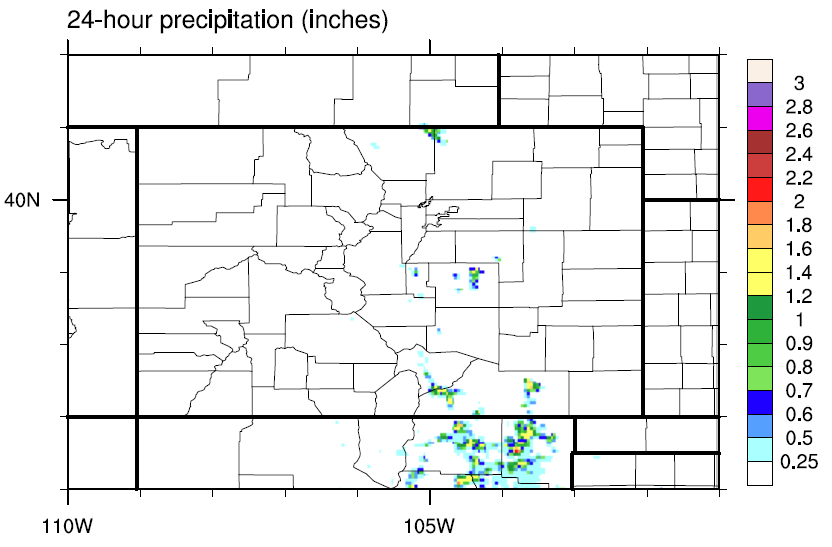
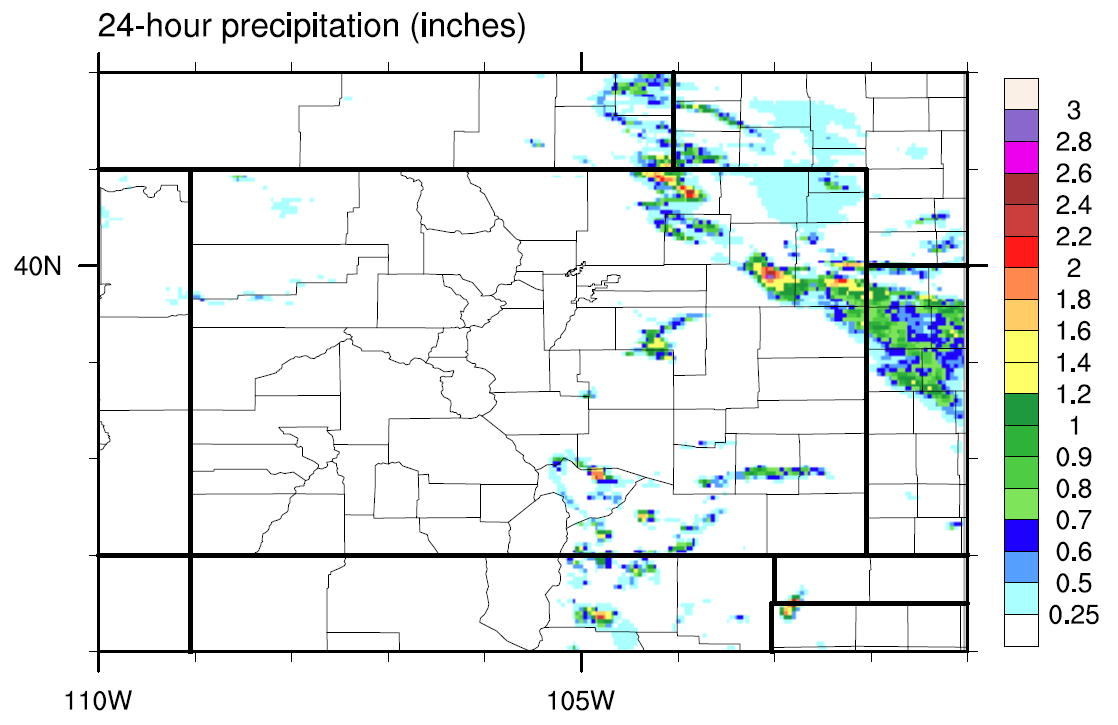
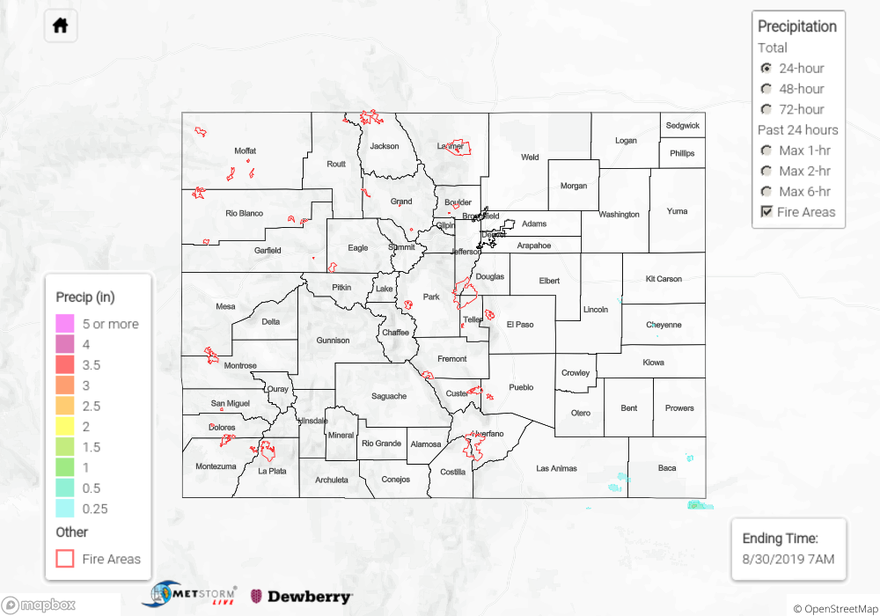
No flash flooding was reported yesterday. For a look at precipitation estimates in your area, please see the State Precipitation Map below.
Click Here For Map Overview
Note: The 24-hour, 48-hour and 72-hour total precipitation do not contain bias corrections today due to errors in the CoCoRaHS data. This means there may be underestimations in QPE over the southwest and southeast corners of the state.