Issue Date: Friday, August 30th, 2019
Issue Time: 10:20AM MDT
Summary:
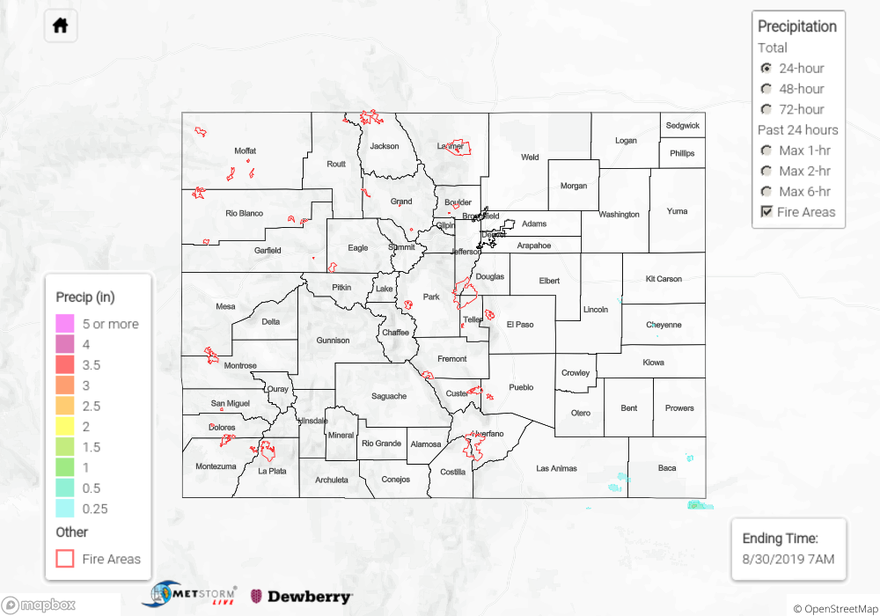
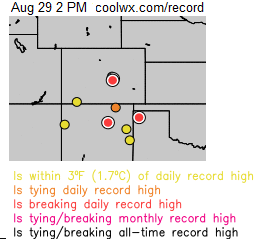
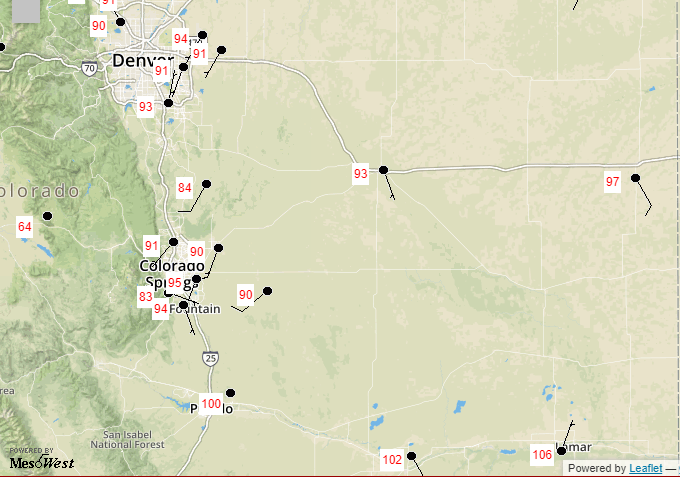
As forecast, not a lot of rainfall yesterday. A couple of weak storms popped along the cold front over Baca and eastern Las Animas County. Max 1-hour rain rates were estimated up to 0.5 inches, but that was just one or two pixels. Totals were reduced to 0.4 inches after the bias correction. High temperatures were the main story yesterday. Despite a cold front dropping through, temperatures remained very high over eastern Colorado. Records were broken by 2PM, and the highest 24-hour maximum temperatures are shown below. Expecting extremely hot temperatures again on Sunday and Monday, so wouldn’t be surprised if more records were broken.
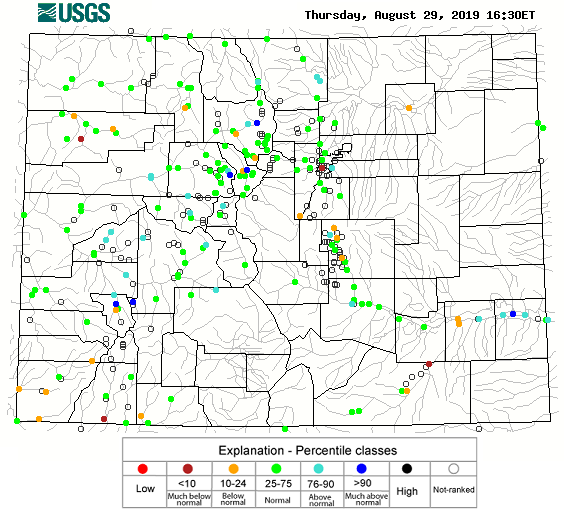
Streamflow looks good as well with most rivers normal or above normal across the state. While it has been a rather dry couple of months (especially over western CO), high snowpack and the wet May and June have kept the streamflow steady. Not surprised to see below normal flows over the Southwest Slope as this area was added to the D1 drought category on Tuesday (see our social media posts for more info). Streamflow does look at little low along the South Platte at Fort Morgan (Morgan County), but flow increases to above normal at Roscoe, NE where the North and South Platte merge.
To see estimated precipitation totals over your neighborhood over the last 72-hours, scroll down the State Precipitation Map below.
Click Here For Map Overview