SPM 05-24-2020: An Overall Pleasant Saturday With Some Gusty Winds And Isolated Storms

Issue Date: Sunday, May 24th, 2020
Issue Time: 10:20AM

Summary:

It was a pleasant start to Memorial Day weekend with seasonable temperatures across the state. High temperatures reached 75-80F in the lower elevations with 50s F observed in the higher terrain. During the afternoon hours, gusty winds developed as a growing boundary layer was able to mix down the strong winds aloft to the surface. Wind gusts in the 30-35mph range were common statewide, with the highest gusts of up to 50mph measured mainly over the Northwest Slope and Grand Valley region.

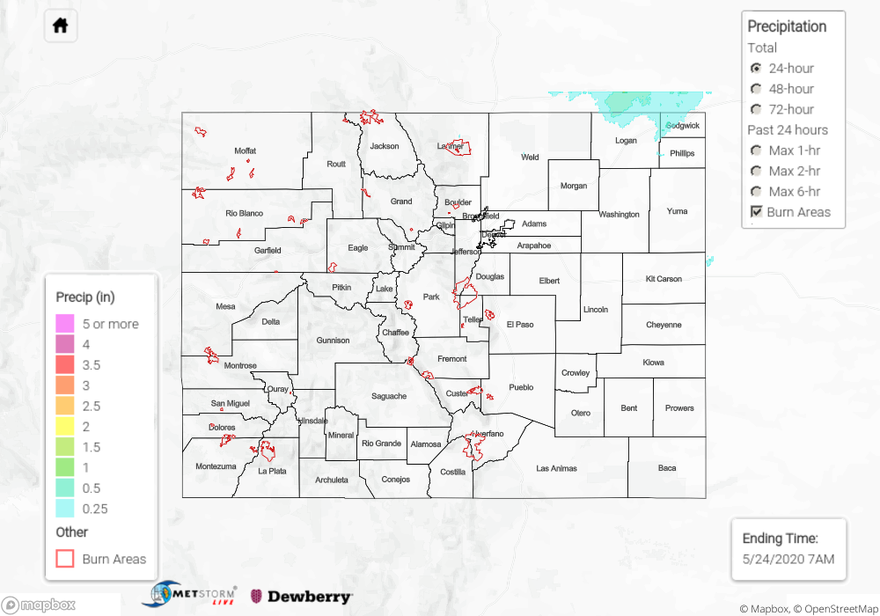
Early morning sunshine led to isolated and scattered thunderstorm activity by the afternoon hours. The strongest storms produced rainfall about 0.25 inches, though over a short 15-30 minute period of time. The rainfall winner was Julesburg, where a CocoRaHS observer reported 0.28 inches. In addition, a landspout tornado was report just east of I-25 near Dacono with pictures being posted on Twitter. Two severe thunderstorm warnings were issued during the afternoon. One along the Nebraska border, the other along the Kansas border. Both warnings were for large hail and gusty wind, though neither was report (the areas are very rural).

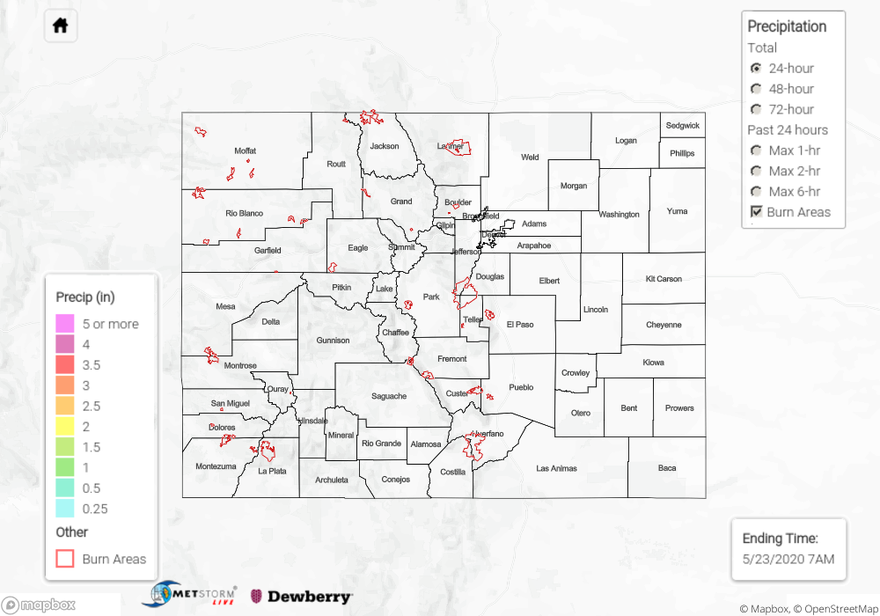
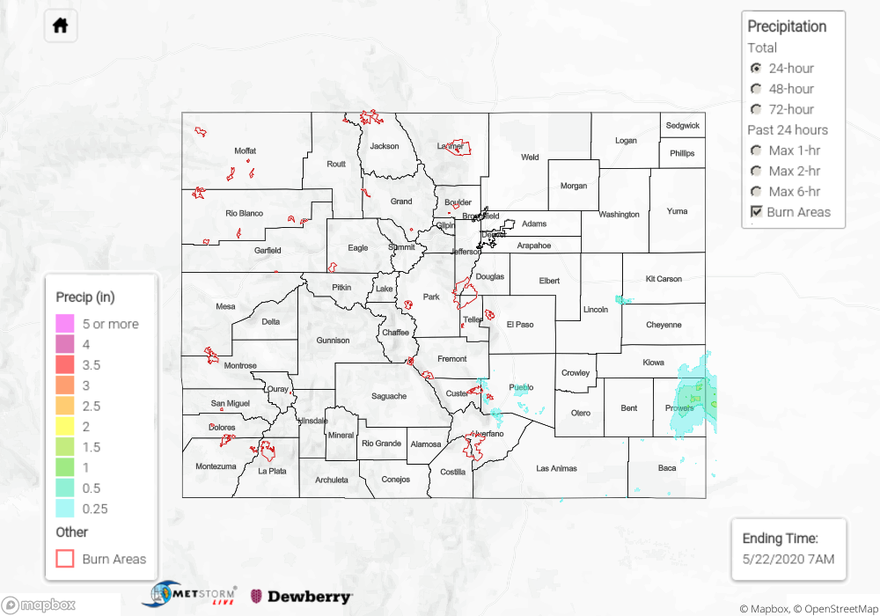
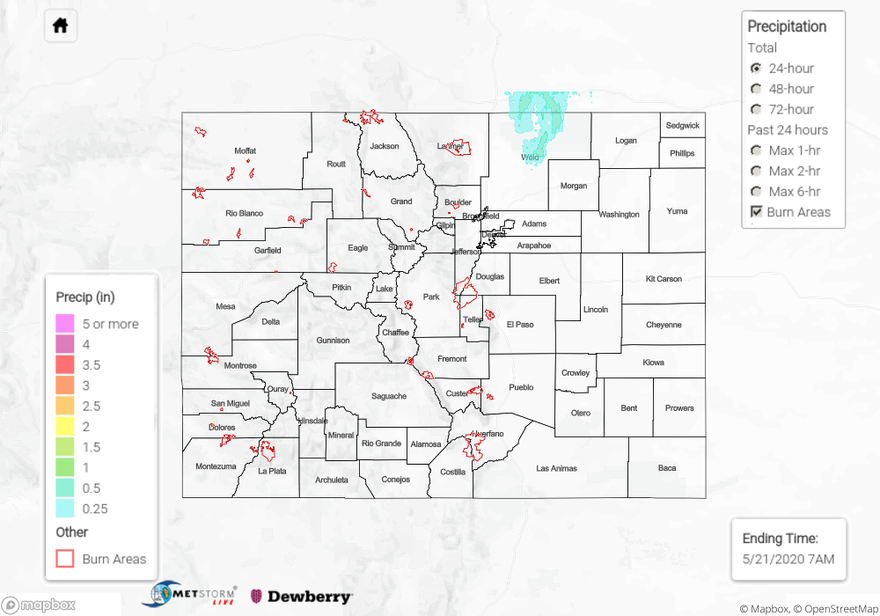
For precipitation estimates in your neighborhood over the last 72-hours, scroll down to the State Precipitation Map below.

Switching topics, the statewide average Snow Water Equivalent fell to about 3 inches as of Friday, or 37% of this year’s peak value. Checking individual basins, the typically warmer southern basins (Rio Grande, Gunnison, Dolores and Arkansas) are getting close to a full melt-out. Meanwhile, the northern basins (Yampa, Upper Colorado, North Platte and South Platte) still have 3-7 inches of SWE remaining, which will be further supported by today’s snowfall.

Click Here For Map Overview

The map below shows radar-estimated, rainfall gage-adjusted Quantitative Precipitation Estimates (QPE) across Colorado. The map is updated daily during the operational season (May 1 – Sep 30) by 11AM. The following six layers are currently available: 24-hour, 48-hour and 72-hour total precipitation, as well as maximum 1-hour, 2-hour and 6-hour precipitation over the past 24 hour period (to estimate where flash flooding may have occurred). The 24-hour, 48-hour and 72-hour total precipitation contain bias corrections that are not disaggregated into the hourly estimates, so there will likely be some differences. The accumulation ending time is 7AM of the date shown in the bottom right corner. Also shown optionally are vulnerable fire burn areas (post 2012), which are updated throughout the season to include new, vulnerable burn areas. The home button in the top left corner resets the map to the original zoom.

SPM 05-23-2020: Dry and Warm Weather to Kick Off Memorial Day Weekend

Issue Date: Saturday, May 23rd, 2020
Issue Time: 9:25AM MDT

Summary:

Dry air and a building ridge kept rainfall away for the most part on Friday, which is always helpful when you’re pitching your tent for the weekend. There was some weak rainfall that accumulated over the Southeast Plains last night, but totals were under 0.10 inches and not widespread. The USGS gauge at Big Sandy Creek (near Lamar) recorded 0.05 inches for the 24-hour period. Two fires are currently occurring in Colorado, and thankfully no new fires were reported yesterday. They are both over the southeast border – PCMS Complex and Cherry Canyon. The Cherry Canyon is the main fire concern and is located 10 miles NW of Kim. So far the blaze has burned 7,400 acres, but crews expect to have it contained in a couple of weeks.

For precipitation estimates in your neighborhood over the last 48-hours, scroll down to the State Precipitation Map below.

Click Here For Map Overview

The map below shows radar-estimated, rainfall gage-adjusted Quantitative Precipitation Estimates (QPE) across Colorado. The map is updated daily during the operational season (May 1 – Sep 30) by 11AM. The following six layers are currently available: 24-hour, 48-hour and 72-hour total precipitation, as well as maximum 1-hour, 2-hour and 6-hour precipitation over the past 24 hour period (to estimate where flash flooding may have occurred). The 24-hour, 48-hour and 72-hour total precipitation contain bias corrections that are not disaggregated into the hourly estimates, so there will likely be some differences. The accumulation ending time is 7AM of the date shown in the bottom right corner. Also shown optionally are vulnerable fire burn areas (post 2012), which are updated throughout the season to include new, vulnerable burn areas. The home button in the top left corner resets the map to the original zoom.

SPM 05-22-2020: Much Needed Rainfall for Prowers County

Issue Date: Friday, May 22nd, 2020
Issue Time: 9:05AM MDT

Summary:

No real measurable rainfall yesterday afternoon except over the Southeast Plains where storms fired along a moisture boundary. The highest rainfall was just to our east in Kansas, but there were still some decent totals over Prowers County. Storms yesterday afternoon also produced some very large hail (2.75 inches diameter) and a couple brief landspouts. Activity started around 4PM with some overnight storms further west in Pueblo County. Radar rainfall estimates vary from 1 to 2 inches in Prowers with a gage in Holly picking up 0.38 inches and a CoCoRaHS report of 1 inch in Granada. Best guess is somewhere around 1.5 inches under the core of the storm. Totals over Pueblo County were estimated just over 0.50 inches. As of this morning, flooding was not reported.

For precipitation estimates in your neighborhood over the last 24- to 72-hours, scroll down to the State Precipitation Map below.

Click Here For Map Overview

The map below shows radar-estimated, rainfall gage-adjusted Quantitative Precipitation Estimates (QPE) across Colorado. The map is updated daily during the operational season (May 1 – Sep 30) by 11AM. The following six layers are currently available: 24-hour, 48-hour and 72-hour total precipitation, as well as maximum 1-hour, 2-hour and 6-hour precipitation over the past 24 hour period (to estimate where flash flooding may have occurred). The 24-hour, 48-hour and 72-hour total precipitation contain bias corrections that are not disaggregated into the hourly estimates, so there will likely be some differences. The accumulation ending time is 7AM of the date shown in the bottom right corner. Also shown optionally are vulnerable fire burn areas (post 2012), which are updated throughout the season to include new, vulnerable burn areas. The home button in the top left corner resets the map to the original zoom.

SPM 05-21-2020: Very Hot, Windy and Dry for Most With Isolated Heavy Rainfall Northeast

Issue Date: Thursday, May 21st, 2020
Issue Time: 11AM MDT

Summary:

Very hot weather persisted across most of the state on Wednesday with high temperatures running up to 20F above normal in parts of the state. In addition, extremely gust winds were observed statewide with peak gusts exceeding 55 mph. As expected, a line of thunderstorms developed across the Northeast Plains during the late afternoon, persisting into the evening hours. Moderate to isolated heavy rainfall was observed with these storms along with gusty winds, hail up to 1.5 inches and a few reports of a landspout type tornado in Weld County. The highest observed rainfall was 0.33 inches in Briggsdale (CoCoRaHS) but it is likely that isolated amounts exceeding 1 inch occurred in areas where storms persisted for a few hours.

As of this writing, flooding was not reported on Wednesday.

For precipitation estimates in your area over the last 24-hours, scroll down to the State Precipitation Map below.

Click Here For Map Overview

The map below shows radar-estimated, rainfall gage-adjusted Quantitative Precipitation Estimates (QPE) across Colorado. The map is updated daily during the operational season (May 1 – Sep 30) by 11AM. The following six layers are currently available: 24-hour, 48-hour and 72-hour total precipitation, as well as maximum 1-hour, 2-hour and 6-hour precipitation over the past 24 hour period (to estimate where flash flooding may have occurred). The 24-hour, 48-hour and 72-hour total precipitation contain bias corrections that are not disaggregated into the hourly estimates, so there will likely be some differences. The accumulation ending time is 7AM of the date shown in the bottom right corner. Also shown optionally are vulnerable fire burn areas (post 2012), which are updated throughout the season to include new, vulnerable burn areas. The home button in the top left corner resets the map to the original zoom.