Issue Date: Sunday, May 24th, 2020
Issue Time: 10:20AM
Summary:
It was a pleasant start to Memorial Day weekend with seasonable temperatures across the state. High temperatures reached 75-80F in the lower elevations with 50s F observed in the higher terrain. During the afternoon hours, gusty winds developed as a growing boundary layer was able to mix down the strong winds aloft to the surface. Wind gusts in the 30-35mph range were common statewide, with the highest gusts of up to 50mph measured mainly over the Northwest Slope and Grand Valley region.
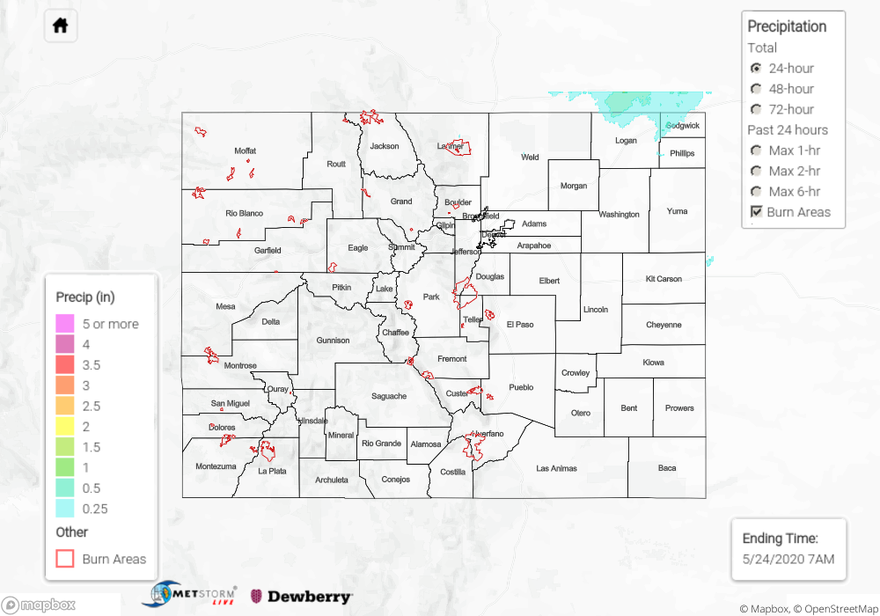
Early morning sunshine led to isolated and scattered thunderstorm activity by the afternoon hours. The strongest storms produced rainfall about 0.25 inches, though over a short 15-30 minute period of time. The rainfall winner was Julesburg, where a CocoRaHS observer reported 0.28 inches. In addition, a landspout tornado was report just east of I-25 near Dacono with pictures being posted on Twitter. Two severe thunderstorm warnings were issued during the afternoon. One along the Nebraska border, the other along the Kansas border. Both warnings were for large hail and gusty wind, though neither was report (the areas are very rural).
For precipitation estimates in your neighborhood over the last 72-hours, scroll down to the State Precipitation Map below.
Switching topics, the statewide average Snow Water Equivalent fell to about 3 inches as of Friday, or 37% of this year’s peak value. Checking individual basins, the typically warmer southern basins (Rio Grande, Gunnison, Dolores and Arkansas) are getting close to a full melt-out. Meanwhile, the northern basins (Yampa, Upper Colorado, North Platte and South Platte) still have 3-7 inches of SWE remaining, which will be further supported by today’s snowfall.
Click Here For Map Overview
