Issue Date: Sunday, June 21st, 2020
Issue Time: 9:00 AM MDT
Summary:
Colorado spent the first day of Summer in Colorado basking in plenty of sunshine, which is great for those of us who were able to spend some time outdoors, but a little tough for those of us who are supposed to write about rainfall. All jokes aside, it was a pleasant day statewide, with mid- and high-level moisture only able to muster up increasing clouds during the evening and overnight hours.
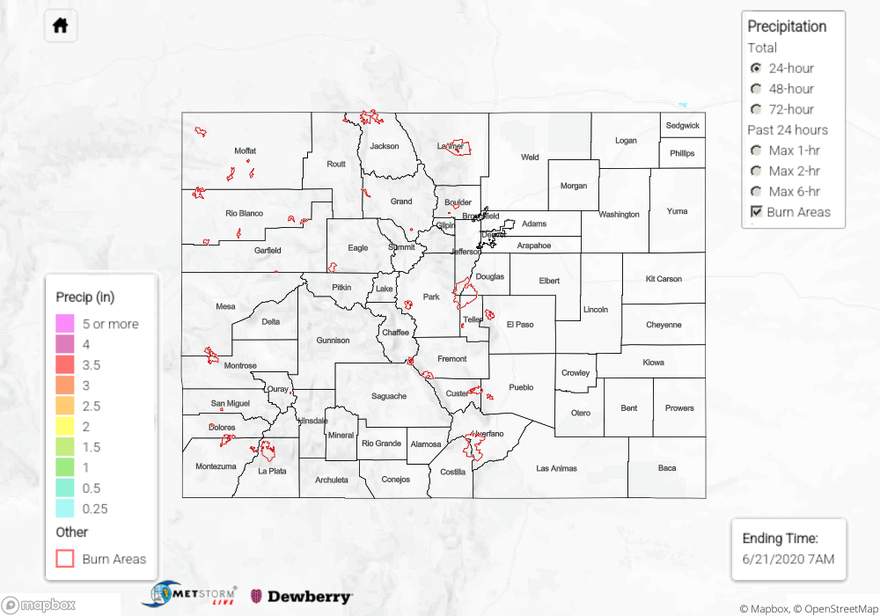
Flooding was not reported on Friday. For rainfall estimates in your area, check out our State Precipitation Map below.
Click Here For Map Overview
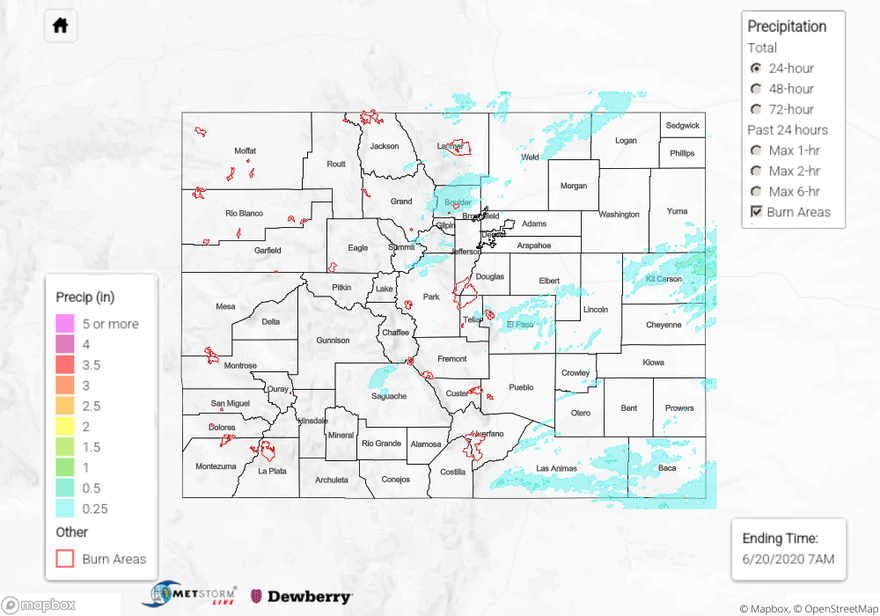
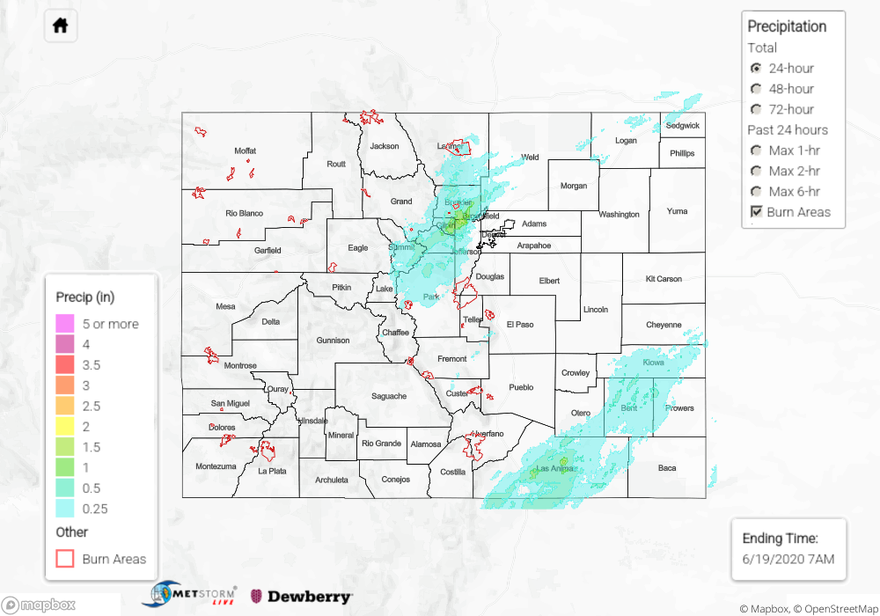
The map below shows radar-estimated, rainfall gage-adjusted Quantitative Precipitation Estimates (QPE) across Colorado. The map is updated daily during the operational season (May 1 – Sep 30) by 11AM. The following six layers are currently available: 24-hour, 48-hour and 72-hour total precipitation, as well as maximum 1-hour, 2-hour and 6-hour precipitation over the past 24 hour period (to estimate where flash flooding may have occurred). The 24-hour, 48-hour and 72-hour total precipitation contain bias corrections that are not disaggregated into the hourly estimates, so there will likely be some differences. The accumulation ending time is 7AM of the date shown in the bottom right corner. Also shown optionally are vulnerable fire burn areas (post 2012), which are updated throughout the season to include new, vulnerable burn areas. The home button in the top left corner resets the map to the original zoom.