Issue Date: Thursday, June 25th, 2020
Issue Time: 10:35AM MDT
Summary
Hot weather continued across the state on Wednesday with high temperatures running up to 10F above normal. The hottest weather (compared to seasonal average) occurred over southwest Colorado with Grand Junction reaching 99F and Cortez reaching 97F.
Scattered showers and thunderstorms popped up again during the afternoon, despite relatively meager moisture. A 10-15 minute period of brief heavy rainfall was common mainly across the higher terrain with 24-hour observed rainfall of 0.25 inches across many counties. The strongest cell of the day appears to have occurred right over the Continental Divide between Fraser and Nederland. The highest observed rainfall came in from the Sawtooth SNOTEL site at 0.5 inches. However, this site is only at 9,600 feet, suggesting some higher amounts were likely over the highest elevations. A look at gauged streams showed brief spikes in the 20-40 cfs range in the flow of the Middle Saint Vrain, South Saint Vrain, Middle Boulder Creek and Ranch Creek (west of the Continental Divide).
In addition to the rain, gusty winds were common again in the afternoon, mainly east of the Continental Divide, owing to the dry sub-cloud layers that were ripe for evaporative cooling. Gusts up to 67 mph were reported at Rocky Flats in Jefferson County, prompting a severe thunderstorm warning for the Denver metro area.
Flooding was not reported on Wednesday. For precipitation estimates in your neighborhood over the last 24-hours, scroll down to the State Precipitation Map below.
Click Here For Map Overview
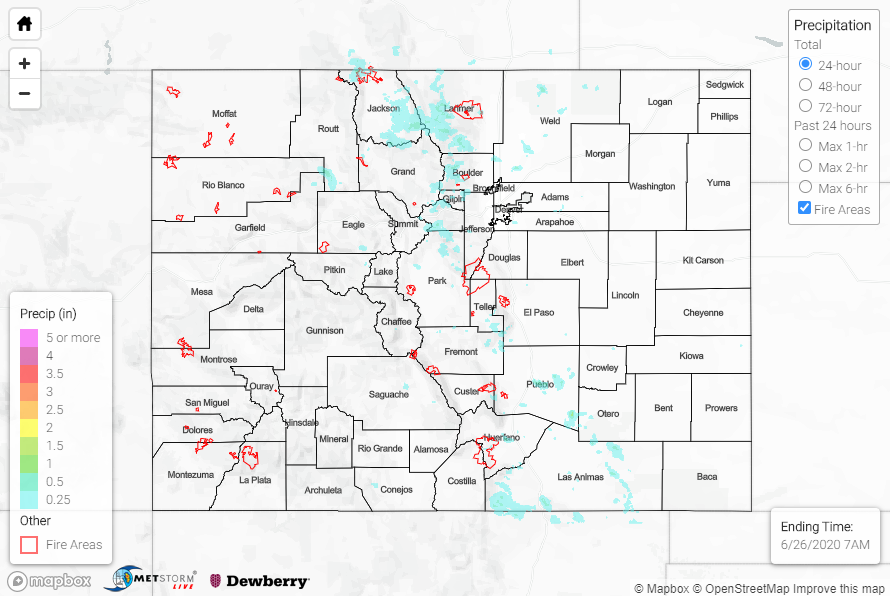
The map below shows radar-estimated, rainfall gage-adjusted Quantitative Precipitation Estimates (QPE) across Colorado. The map is updated daily during the operational season (May 1 – Sep 30) by 11AM. The following six layers are currently available: 24-hour, 48-hour and 72-hour total precipitation, as well as maximum 1-hour, 2-hour and 6-hour precipitation over the past 24 hour period (to estimate where flash flooding may have occurred). The accumulation ending time is 7AM of the date shown in the bottom right corner. Also shown optionally are vulnerable fire burn areas (post 2012), which are updated throughout the season to include new, vulnerable burn areas. The home button in the top left corner resets the map to the original zoom.
Note: The 24-hour, 48-hour and 72-hour total precipitation do not contain bias corrections today due to errors in the CoCoRaHS data. This means there may be underestimations in QPE over the southwest and southeast corners of the state.