Issue Date: Monday, June 22nd, 2020
Issue Time: 9:40AM MDT
Summary:
It was another beautiful day across the state with highs in the 90Fs over the western valleys/eastern plains, mid to upper 70Fs over the mountain communities, and 80Fs along the Urban Corridor. Some afternoon storms developed over the northern mountains with a passing shortwave and this helped produce some 50 mph gusts over western Colorado. Max 1-hour rain rates were around 0.25 inches over the Northern Mountains and Front Range. An ALERT gage picked up 0.39 inches near Bear Peak (NCAR Mesa Lab area). Storms moved into the adjacent, eastern plains by the late afternoon, and it got a little windy as the moved into the lower elevations (lack of moisture). Rain rates dropped off and gusts along the I-25 corridor were reported in the 50 to 60 mph range. A few broken limbs were reported near Cherry Creek Reservoir around 6PM associated with an outflow boundary. As expected, there was no flooding reported on Sunday.
The East Canyon fire has now burned 2,900 acres, but the good news is that it is 79% contained (as of Sunday afternoon). That fire has been burning since June 14th and was started by lightning. The Sand Creek Fire, near the Hinsdale and Archuleta County line or 20 miles northwest of Pagosa Springs has now burned 60 acres. This fire was started on June 15th from lightning and is burning in the Little Sand Fire scar (2012).
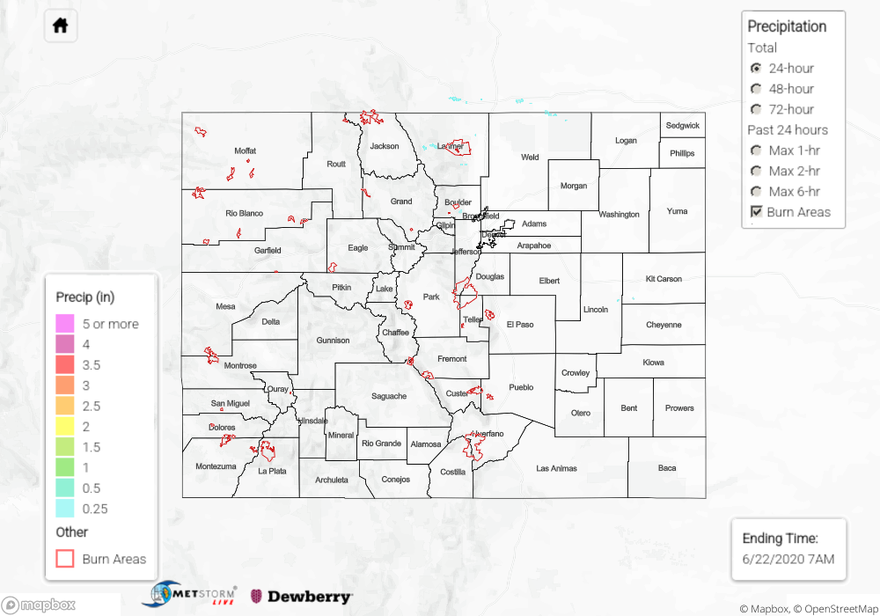
For precipitation estimates in your neighborhood over the last 24 to 72-hours, scroll down to the State Precipitation Map below.
Click Here For Map Overview