Issue Date: Wednesday, June 24th, 2020
Issue Time: 9:30AM MDT
Summary:
Slow moving storms in a fairly moisture rich environment caused some heavy rainfall on Tuesday afternoon into the evening. Storms were a bit more widespread when compared to Tuesday, but not quite as severe without upper level support. QPE from MRMS, Stage IV, and MetStorm Live were quite a bit different from each other (not shown). Max 1-hour rain rates up were estimated around 0.75 inches (west) and 1.5 (east) with MetStorm Live, and 2-hour totals were just over one inch under the stronger storms that formed over the Palmer Ridge and Raton Ridge. After a bias correction (using gaged data), 24-hour totals dropped to one inch for those storms. Some three-quarter inch hail was also reported for the stronger storms that formed over the Southeast Plains border counties.
There were a couple Flood Advisories issued over Park, Giplin, and Jefferson Counties, and the closest ALERT gage (El Rancho in Genesee Park) recorded 0.47 inches. Additionally, two Flash Flood Warnings were issued in El Paso and Teller County. Two CoCoRaHS stations (Woodland Park and Cripple Creek) reported 1.16 inches for the 24-hour period. All in all, the slow storm motion really allowed the precipitation to accumulate. As of this morning, there was no flooding reported.
For precipitation estimates in your neighborhood over the last 24-hours, scroll down to the State Precipitation Map below.
Click Here For Map Overview
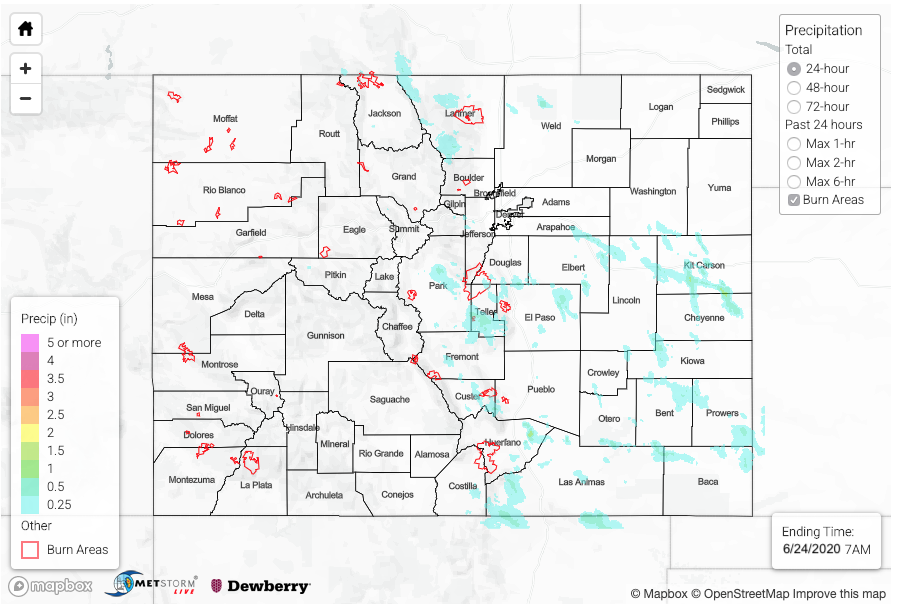
The map below shows radar-estimated, rainfall gage-adjusted Quantitative Precipitation Estimates (QPE) across Colorado. The map is updated daily during the operational season (May 1 – Sep 30) by 11AM. The following six layers are currently available: 24-hour, 48-hour and 72-hour total precipitation, as well as maximum 1-hour, 2-hour and 6-hour precipitation over the past 24 hour period (to estimate where flash flooding may have occurred). The 24-hour, 48-hour and 72-hour total precipitation contain bias corrections that are not disaggregated into the hourly estimates, so there will likely be some differences. The accumulation ending time is 7AM of the date shown in the bottom right corner. Also shown optionally are vulnerable fire burn areas (post 2012), which are updated throughout the season to include new, vulnerable burn areas. The home button in the top left corner resets the map to the original zoom.