Issue Date: Friday, July 3rd, 2020
Issue Time: 10:40AM MDT
Summary:
Storms fired along a moisture boundary over the eastern plains yesterday. It was a battle between instability/moisture and the developing trough, which was mixing the severe weather ingredients eastward. Higher moisture remained over the Northeast Plains just to the north of the surface low. Storms were barely moving, so they produced some heavy rainfall as well as damaging hail. As far as storm reports, there were several tornadoes reported over Washington and Kit Carson County. These were likely weak landspouts as upper dynamics were not great for tornado formation. Additionally, storm chasers reported 2.75 inch hail (baseball size) over Washington County! I can only image the damage that did to crops and property.
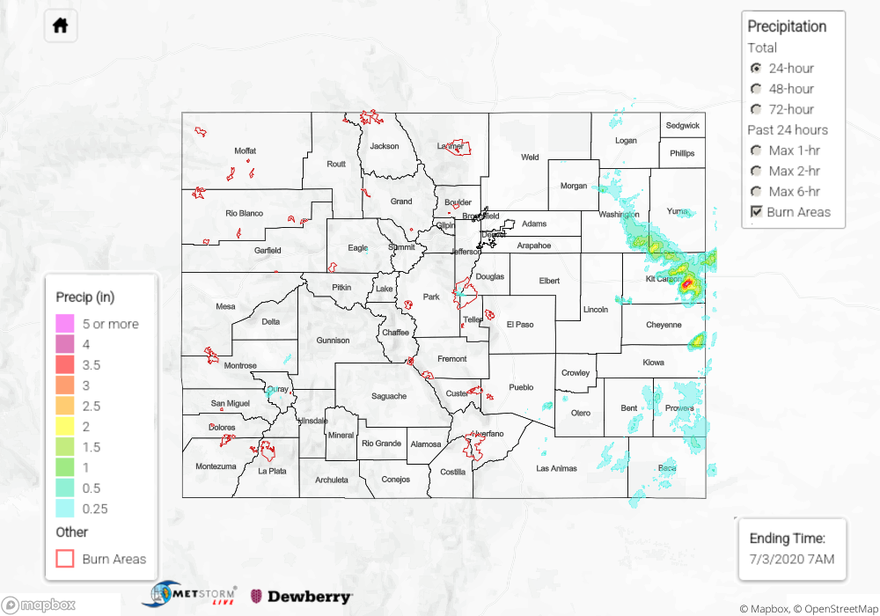
The heavy rainfall cores were rather small in size, but some impressive rainfall totals came out of the storms. The COAGMET station near Joes, CO recorded 1.23 inches and another nearby WxUnderground station recorded 0.71 inches. So, the QPE estimates of rainfall over southwest Yuma County are likely overestimated below. Twitter videos and CDOT cams reported some minor flooding in fields and parking lots near Burlington. MetStorm Live shows 2.5 inches of QPE over Burlington, CO. A CoCoRaHS in town recorded 1.9 inches over the same area, so the QPE estimates are likely high over this area as well. Additionally, the COAGMET station in Burlington recorded 0.66 inches in an area that is estimated at 1.5 inches. The Burlington Carson County Airport recorded 3.38 inches for the 24-hour period just south of town, which is likely driving the QPE for MetStorm. There were several hail reports in the area, so I’m wondering if this gage wasn’t contaminated by it? I would have expected a lot more flooding if that was the case as well. QPE from AHPS has between 1.5 and 2.0 inches in this same area and MRMS has about 3 inches. Overall, I think these numbers are bit high after looking at observations, so take the QPE below with a grain of salt.
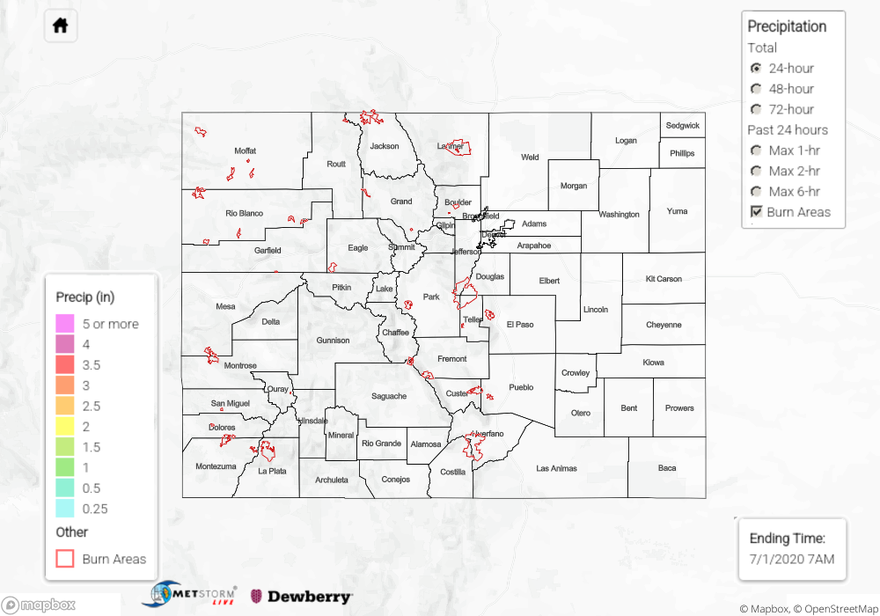
For precipitation estimates in your neighborhood over the last 24 to 72-hours, scroll down to the State Precipitation Map below.
Click Here For Map Overview