Issue Date: Friday, July 31st, 2020
Issue Time: 10:55AM MDT
Summary:
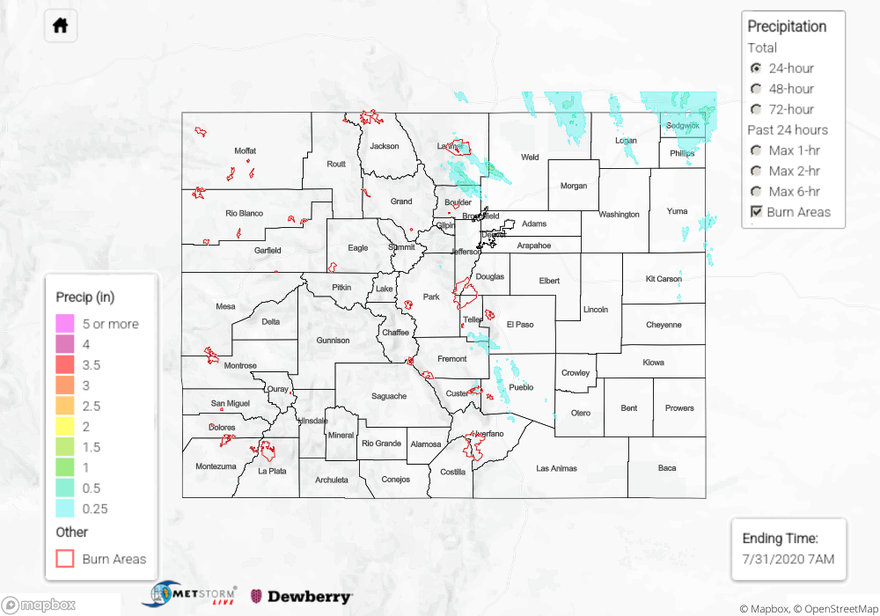
Some strong storms developed over Larimer, Weld, and Boulder counties along the northern Urban Corridor and Front Range, which were able to generate penny-sized hail and very heavy downpours. The heaviest rain fell near the town of Windsor with rain gages reporting up to 1.53 inches (CoCoRaHS) and two heavy rainfall reports of 1.24 and 1.45 inches. Four other CoCoRaHS rain gauges reported over 1 inch between Windsor and Greeley. Today’s QPE map picked up on the 1+ inch totals near Windsor, but may underestimate totals closer to Greeley, where less than 1 inch is indicated. A social media post indicated that some road flooding occurred in the town of Windsor. This is quite impressive as the storms had fairly quick storm motions. The outflow/moisture boundary pushed back in from the Northeast Plains, which supplied the moisture for the storms. Storms also tracked off the mountains near Fort Collins, producing up to 0.58 inches of rain just west of town. Additional storms tracked just south in northern Boulder County, which dropped up to 0.69 inches between Estes Park and Longmont. Note that CoCoRaHS sites are 24-hour rain totals, so they reflect 2 to 3 round of storms tracking over the area.
A series of severe thunderstorms also fired over the southern Front Range mountains and tracked south-southeast into Fremont, Pueblo, and Custer counties. These storms dropped up to golf ball sized hail and brief heavy rain. It’s very hard to get this large of hail during the summer with the increased freezing level height. A Flash Flood Warning was issued over the Junkins burn area in eastern Custer County, based on radar data and QPE and rain gauge estimates in the area indicate up to or just over 0.5 inches of rain fell between Canon City and Pueblo. No flooding was reported as of this morning.
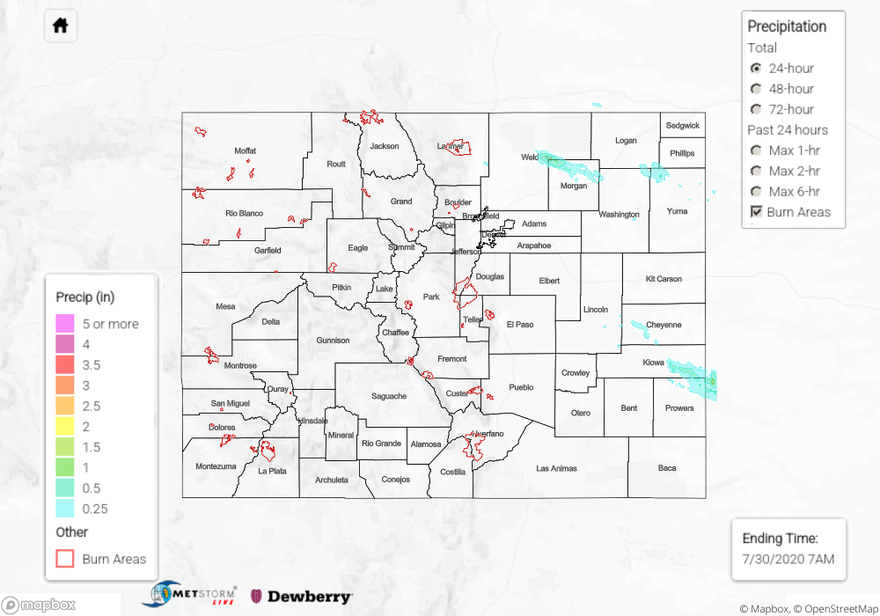
Low-level clouds and persistent rain showers were present over the Northeast Plains yesterday as cool air was ushered into the area on the back side of a low pressure system that tracked through Kansas. Limited instability only allowed showers to produce around 0.5 inches of rainfall for locations near the Colorado and Nebraska border. The highest rain gauge report is 0.45 inches from a CoCoRaHS observer near the CO/NE border in eastern Sedgwick County. Better yet, the cool air and cloud cover kept temperatures ~10 degF below normal for the eastern plains. Denver only hit 80F for a high yesterday, with temperatures staying in the 70Fs farther northeast. Hope you enjoyed the cooler temperatures as highs are expected to rise into the upper 80Fs again today into Saturday.
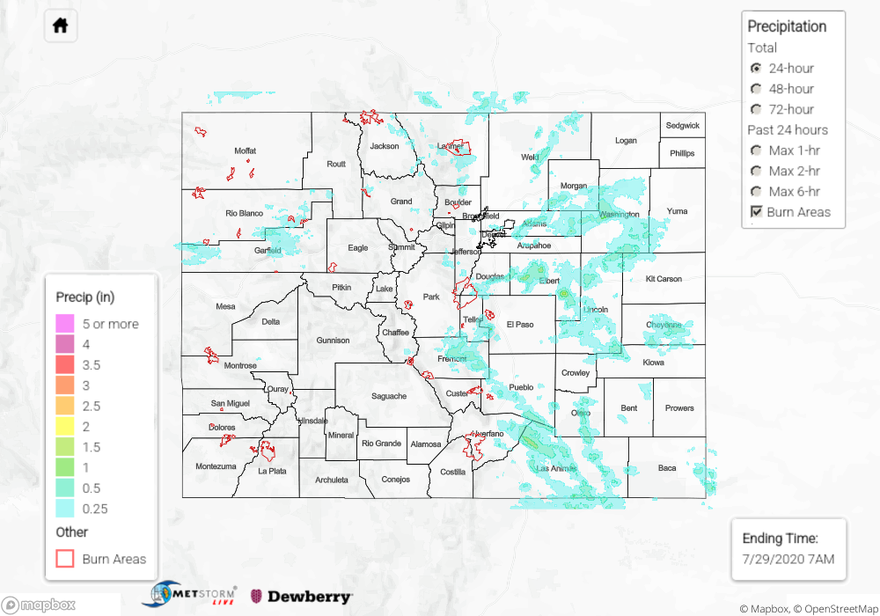
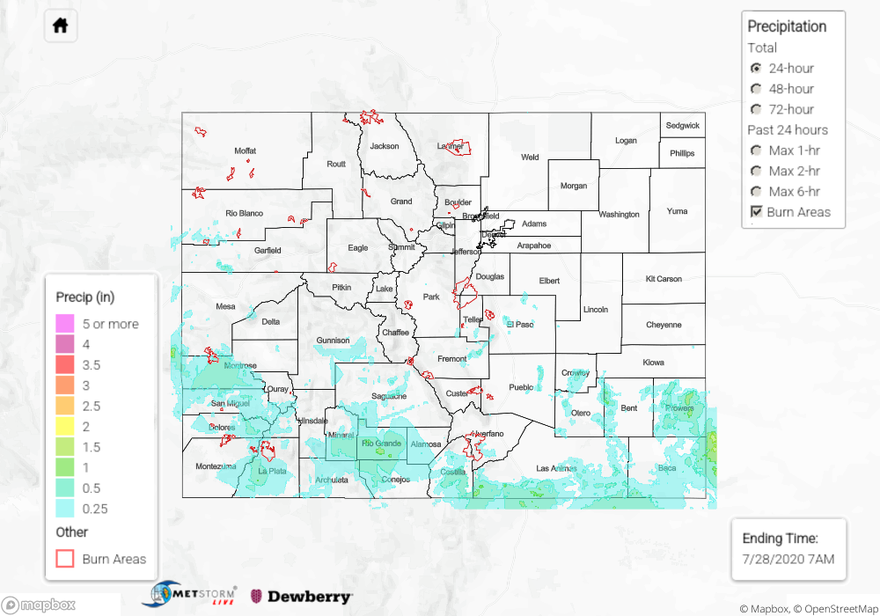
For rainfall estimates in your area over the last 24 hours, check out our State Precipitation Map below.
Click Here For Map Overview