Issue Date: Tuesday, July 28th, 2020
Issue Time: 11AM MDT
Summary:
Heavy rain fell across southern Colorado again yesterday, including the interior San Luis Valley. Yesterday was Day 5 for those keeping track of this event. In the SLV, a CoCoRaHS station recorded a 24-hour total of 1.16 inches in Monte Vista, and two CoCoRaHS station in Alamosa were just under an inch. The airport just south of town recorded 0.26 inches. Heavy rainfall over Blanca, CO caused a few county roads to wash out just east of Alamosa and north of San Luis around 4:30PM. A SNOTEL station located on the west side of the Sangre de Cristo Mountains in the area recorded 0.9 inches, so there was a lot of water rushing into the valley.
The southern San Juan Mountains and Southwest Slope got yet another round of heavy rainfall over saturated soils. We’ve been watching the totals closely, and it seems any higher intensity storms (>0.5 in/hr) that can form, seem to be causing mud and debris flows at this point. Such was the case again yesterday when a debris flow and mud slide were triggered just east of Telluride. QPE was estimated just under a half inch, and an observation of 0.61 inches in the area corroborated these rain rates. One of the mudflows was 35 feet wide and 3 to 5 feet deep and trapped hikers and motorists in the Bridal Veil Falls area. Thankfully, no injuries were reported. This is also why the eastern half of the San Juan Mountains are under a Low threat today.
The highest 24-hour rain gauge report was 1.77 inches from an ASOS station in western Archuleta County. Other locations across La Plata, Montezuma, and Archuleta counties, reported 0.08 to 1.61 inches of rain, indicating heavy rainfall was, once again, quite widespread. That puts the event totals (using AHPS) over the southern San Juan Mountains well over 2 inches (widespread) with more isolated totals up to 4 inches. Did a quick CoCoRaHS look for the date range. The highest 5-day total was 3.56 inches at a gauge 17 miles ENE of Dolores in the San Juan National Forest. Not surprising, local streams and creeks are running high. The following USGS gages are running at 85% or higher, and some have about as much flow as the spring runoff peak (!): San Juan River near Carracas, Los Pinos River at La Boca, McElmo Creek near the stateline and the Dolores River at Dolores (below that very high CoCoRaHS gauge). If you have any other flooding reports for the event, please let us know here: https://archive-coftb.dewberryanalytics.com/?page_id=11165
Eastern Colorado also got some heavy rainfall as storms fired from a passing vorticity max in the early afternoon. About 1.5 inches was reported in Prowers County from the storms, so the QPE may be slightly underestimated by MetStorm. A Twitter post from someone in the area showed water running like a river through their fields. This was in the same area that got heavy rainfall on Sunday, so the soils were already saturated when the heavy rain began. Lastly, two Flash Flood Warnings were issued for the Spring Creek burn area, and a CoCoRaHS on the south end of the burn area indicated 0.36 inches fell. Thankfully, no debris flows or flash flooding was reported. One more day for this 2020 monsoon event, so be sure to tune back in tomorrow to see how it wraps up!
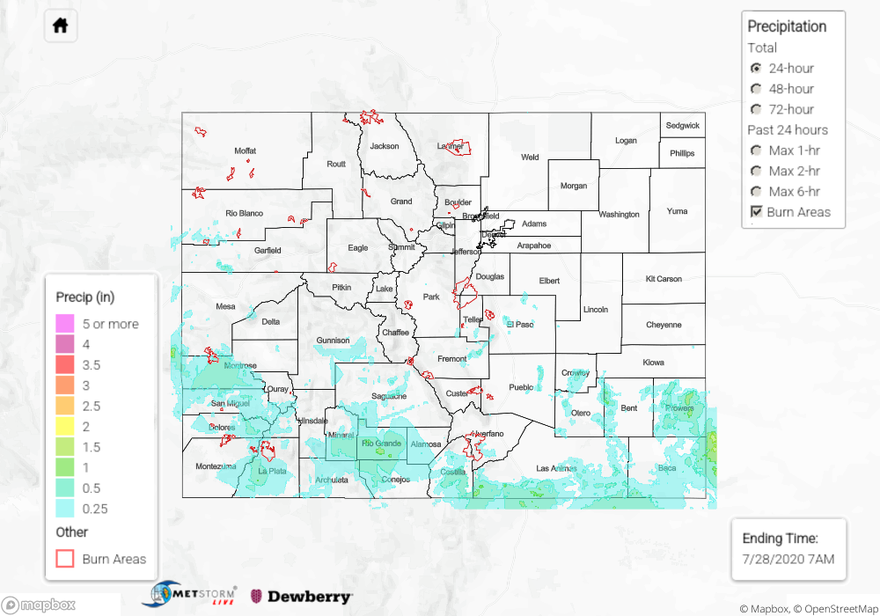
For rainfall estimates over your neighborhood in the last 24 to 72-hours, scroll down to our State Precipitation Map below.
Click Here For Map Overview