Issue Date: Tuesday, August 4th, 2020
Issue Time: 10:55AM MDT
Summary:
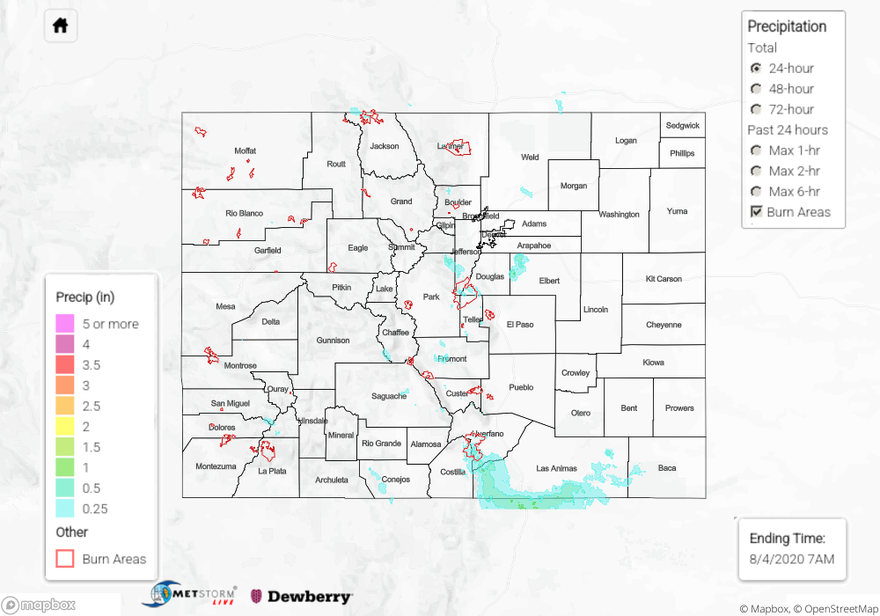
Storms generated some flash flooding over the Spring Creek burn area yesterday. Three flash flood reports were generated southwest of the town of La Veta, over the southern portion of the Spring Creek burn area. Rushing water overtopped county route 421 and highway 12, and a debris flow closed a section of highway 12. USGS rain gauges in this area recorded up to 0.98 inches of rain, which is well over the expected 0.5 inch threshold for flash flooding. Nearby CoCoRaHS observers reported 0.54 and 0.7 inches of rain, which backs up the USGS rain gauge. The QPE map agrees with these totals and shows most of the southern half of the burn area likely picked up over 0.5 inches. This rainfall warranted the flash flood warnings issued by NWS Pueblo. Decent rain totals were also observed over the Raton Ridge as numerous storms moved over the area well into the evening hours, but limited rain gauges in the area indicate just under 0.5 inches fell.
Storms that fired over the southern Front Range produced isolated areas of moderate rainfall over 0.5 inches. The heaviest rain from a severe-warned storm that fired over northwestern Elbert County. Between 0.77 and 1.0 inches of rain was reported by CoCoRaHS observers from this storm, with the heaviest rain falling over the town of Elizabeth.
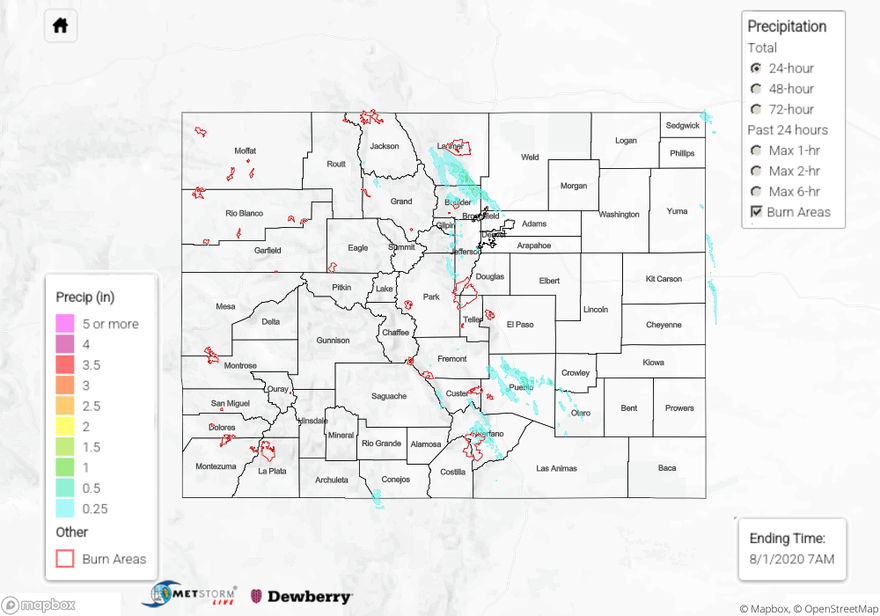
For rainfall estimates in your area over the last 24 hours, check out our State Precipitation Map below.
Click Here For Map Overview