Issue Date: Sunday, August 2nd, 2020
Issue Time: 10:15AM MDT
Summary:
Not much change in details from Friday into Saturday, so the QPE footprint looks pretty similar over eastern Colorado. Perhaps there was a bit more drying, so totals weren’t quite as high. A gauge in Fort Collins (from their mesonet) picked up 0.36 inches, and a USGS gage near Colorado Springs picked up the same. While the higher totals remained isolated, the stronger storm cores were likely producing around 0.5 inches. Over the Front Range, there was a severe thunderstorm in Larimer County that produced some severe hail. Reports of hail diameter were between 1 and 1.75 inches. Lastly, the Spring Creek burn area was warned for Flash Flooding. A Weather Underground station picked up about a quarter inch, and flooding was not reported as of this morning.
There were a couple differences between the QPE maps. One, additional storms fired overnight in the Northeast Plains associated with an upper level jet streak. Totals just under 0.75 inches were estimated with a 0.63 inch observation in eastern Kit Carson County. Secondly, more moisture was available over western Colorado, so storm coverage was bit better (south). High-bases still meant that storms produced more wind than rainfall, but the San Juan Mountains picked up isolated totals around 0.5 inches as well. A 62-mph gust was measured at the La Plata County Airport, but no damage was reported.
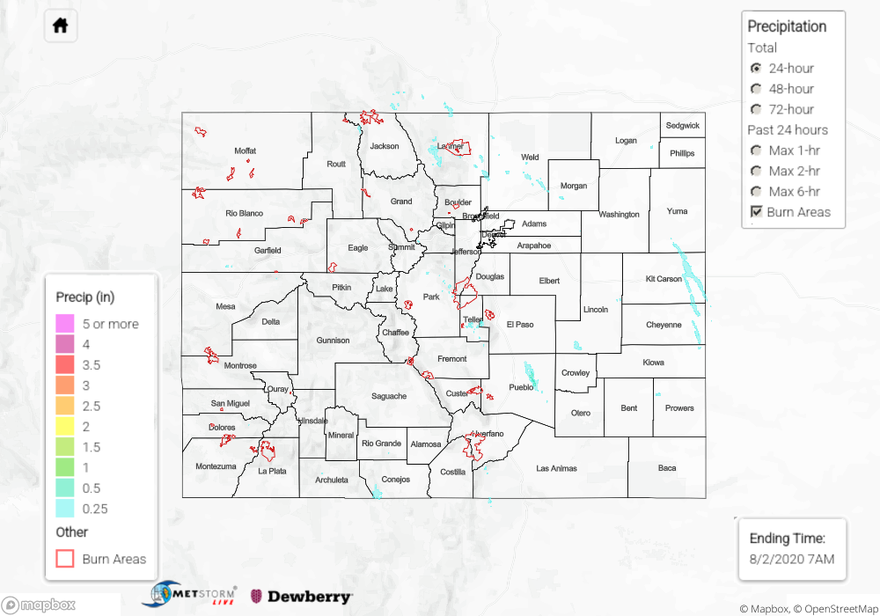
To see precipitation estimates over your community the last 24 to 72-hours, scroll down to the State Precipitation Map below.
Click Here For Map Overview