SPM 09-09-2020: Snowfall & Thunderstorms

Issue Date: Wednesday, September 9th, 2020
Issue Time: 10:35AM MDT

Summary:

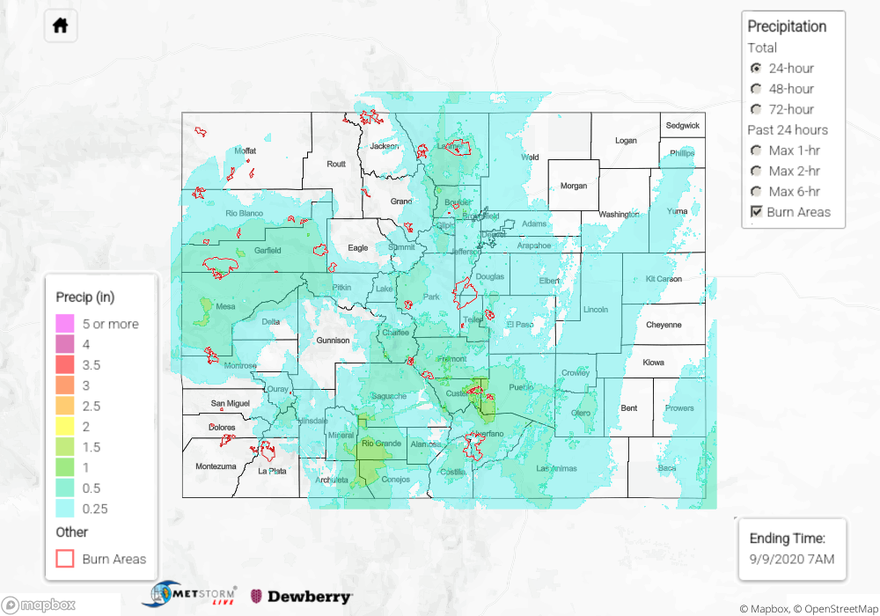
The cold front pushed south in the overnight hours on Monday. This allowed snow to start falling early Monday into Tuesday across the state. The cold air was a bit slower to move south over western Colorado. With temperatures in the 60Fs and 70Fs across the southern border, a couple thunderstorms developed over the southern San Juan Mountains and eastern Southwest Slope before the front arrived. Quarter inch hail was reported with the storms near Durango and Silverton and 45 mph wind gusts before the rain crossed over to snow at the higher elevations. Over southern Archuleta County, a heavy rainfall report of 1.62 inches was reported (CoCoRaHS) for the 24-hour period. Conejos had another report of 1.39 inches with Rio Grande County receiving a report of 1.69 inches. As far as snowfall reports as of 10AM, reports were only between 2 and 3 inches over the San Juan Mountains, but likely higher amounts fell. The Grand Valley, specifically Grand Junction received between 0.60 and 1 inch of rainfall. This is the first significant rainfall for the area for quite some time (June). While not a drought buster, the rainfall and cooler temperatures must have felt refreshing. However, it is likely that crops were damaged with temperatures falling to 32F for a few hours. For snowfall, 1 to 4 inches were reported over the higher elevations in Mesa County. Flooding has not been reported as of 10:30AM this morning, and the snow and mix precipitation continues. Tune back in tomorrow for the latest observations. The snow reports below are only a sample of what have fallen and been reported. Significant melting occurred over the lower elevations due to the non-frozen soils and warm pavement.

Snow reports as of this morning (10:30AM):

  • Central Mountains: 2 to 6 inches; 6-12 inches in Chaffee County
  • San Juan Mountains: 1 to 3 inches
  • Northwest Slope/Northern Mountains: 4 to 7 inches (very strong winds with gusts recorded between 45 and 65 mph)
  • Front Range: 3.5 to 6.5 inches
  • Southern Urban Corridor/Palmer Ridge: 3 to 6 inches
  • Northern Urban Corridor: 1 to 4 inches (higher amounts in Fort Collins)
  • Southeast Mountains: 6 to 14 inches
  • Western Southeast Plains/Raton Ridge: 1 to 4 inches
  • Northeast Plains: 0.5 to 3 inches
  • San Luis Valley: 13.8 inches (Alamosa)
  • Grand Valley/Southwest Slope: 1 to 4 inches (higher elevations)

Large Colorado wildfire update (as of 10:30AM on InciWeb):
Cameron Peak in the Medicine Bow Mountains: 102,596 acres; 4% contained
Williams Fork in the Arapaho National Forest: 12,157 acres; 10% contained
Pine Gulch north of Grand Junction: 139,007 acres; 95% contained
Grizzly Creek in Glenwood Canyon: 32,464 acres; 91% contained

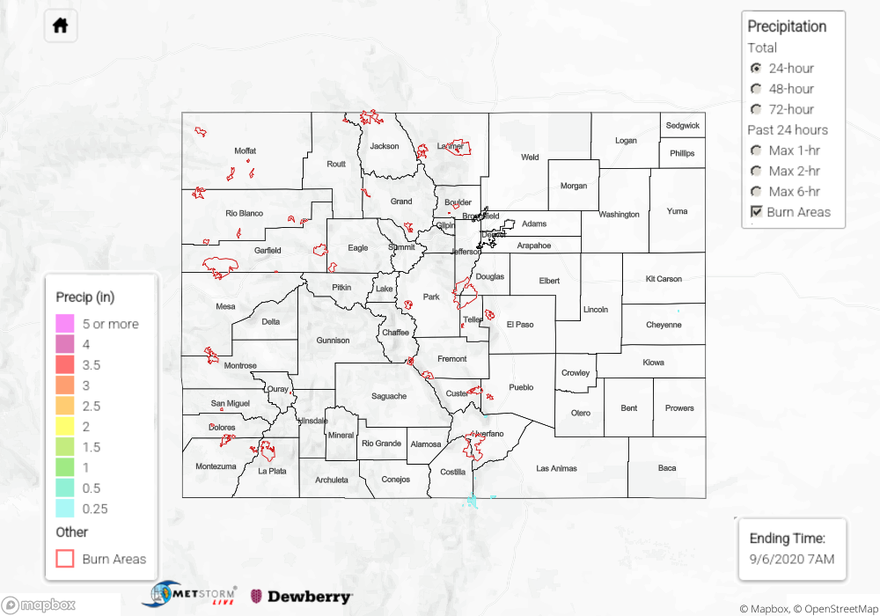
To see (liquid) precipitation estimates over your neighborhood the last 24-hours, scroll down to the State Precipitation Map below.

Click Here For Map Overview

The map below shows radar-estimated, rainfall gage-adjusted Quantitative Precipitation Estimates (QPE) across Colorado. The map is updated daily during the operational season (May 1 – Sep 30) by 11AM. The following six layers are currently available: 24-hour, 48-hour and 72-hour total precipitation, as well as maximum 1-hour, 2-hour and 6-hour precipitation over the past 24 hour period (to estimate where flash flooding may have occurred). The 24-hour, 48-hour and 72-hour total precipitation contain bias corrections that are not disaggregated into the hourly estimates, so there will likely be some differences. The accumulation ending time is 7AM of the date shown in the bottom right corner. Also shown optionally are vulnerable fire burn areas (post 2012), which are updated throughout the season to include new, vulnerable burn areas. The home button in the top left corner resets the map to the original zoom.

SPM 09-08-2020: Cold Air and Beneficial Precipitation Moved In Overnight

Issue Date: Tuesday, September 8th, 2020
Issue Time: 11:00AM MDT

Summary:

Yesterday started out hot, dry, and smoky but ended chilly and wet. Abundant smoke across the state yesterday kept high temperatures down a few degrees, with Denver and Grand Junction only getting into the low 90Fs. However, locations in the Southeast Plains were still able to get up to the 100F mark where there was less smoke coverage. This quickly changed as a cold front came barreling through the plains of eastern Colorado earlier than expected, passing through Denver around 5PM. A 56 mph wind gust was recorded in Pueblo, CO as the front moved through around 9PM. A couple more surges of colder air moved into the plains overnight, which created upslope flow and allowed rain (plains) and snow (foothills/mountains) to fall. The highest precipitation totals up to 1.0 inch this morning are over the Northeast Plains, where some weak convection was able to generate some heavier rainfall. No flooding was reported with this heavier rain. Elsewhere, totals were generally 0.5 inches or less. Snowfall up to 2.5 inches was reported in the foothills of the Front Range, with 0.4 to 0.5 inches of liquid-equivalent precipitation (a 5:1 snow:liquid ratio). This precipitation and snowcover will hopefully suppress the wildfires, especially the Cameron Peak fire, which has exploded over the holiday weekend (see details below).

Colorado large wildfire update (as of 11:00AM on InciWeb):
Cameron Peak in the Medicine Bow Mountains: 102,596 acres; 4% contained (explosive increase in size)
Williams Fork in the Arapaho National Forest: 12,157 acres; 10% contained
Grizzly Creek in Glenwood Canyon: 32,464 acres; 91% contained (increased containment)
Pine Gulch north of Grand Junction: 139,007 acres; 87% contained

For precipitation estimates in your area over the last 24 hours, check out our State Precipitation Map below. Note that some of this precipitation likely fell as snow at higher elevation locations.

Click Here For Map Overview

The map below shows radar-estimated, rainfall gage-adjusted Quantitative Precipitation Estimates (QPE) across Colorado. The map is updated daily during the operational season (May 1 – Sep 30) by 11AM. The following six layers are currently available: 24-hour, 48-hour and 72-hour total precipitation, as well as maximum 1-hour, 2-hour and 6-hour precipitation over the past 24 hour period (to estimate where flash flooding may have occurred). The 24-hour, 48-hour and 72-hour total precipitation contain bias corrections that are not disaggregated into the hourly estimates, so there will likely be some differences. The accumulation ending time is 7AM of the date shown in the bottom right corner. Also shown optionally are vulnerable fire burn areas (post 2012), which are updated throughout the season to include new, vulnerable burn areas. The home button in the top left corner resets the map to the original zoom.

SPM 09-07-2020: Bad Air Quality, Smoke, & Ash Blanket Urban Corridor

Issue Date: Monday, September 7th, 2020
Issue Time: 10:55AM MDT

Summary:

Yesterday felt quite apocalyptic for the Urban Corridor as thick smoke from the rapidly expanding Cameron Peak wildfire covered the area under northwest flow. This smoke kept temperatures down a few degrees, but Denver still tied the record high temperature of 97F for the day by 12:35PM MDT (just before thick smoke moved over the area). Reports (and pictures) of ash falling from the sky were all over social media. In western Colorado, Grand Junction added another record high temperature of 99F, breaking last year’s record of 97F. In the Southeast Plains, less smoke and no cloud cover allowed La Junta to reach a preliminary new all-time September high temperature for the state of Colorado at 108F. This adds to the already record-breaking heat that Colorado has been experiencing this summer. Luckily, rapid changes are in store this week.

The image below is fascinating and shows the power of the Cameron Peak wildfire, which grew by almost 25,000 acres yesterday and overnight (see stats below). The picture was taken around 5:30PM MDT by Jason Bloch and was shared around social media yesterday afternoon. You can see very well the boundary (black line) between planetary boundary layer (lower atmosphere) and the free atmosphere (upper atmosphere). The boundary layer is filled with smoke and haze, which is the air we are breathing at the surface, whereas the free atmosphere is relatively clean. The Cameron Peak wildfire is burning so rapidly and so hot that it is creating a strong updraft (red on image below) that penetrates through the boundary layer and into the free atmosphere, similar to what a convective thunderstorm would do. In fact, the updraft created its own “pyrocumulonimbus” cloud over the fire due to the rapidly rising air. This cloud did not produce rainfall in this case due to the drier air in place, but ash did fall out of this cloud well downwind over the Denver area. The transport of smoke high up into the free atmosphere is how smoke can be transported thousands of miles downstream. When this smoke gets trapped in the boundary layer during smoldering or less intense fire activity, it acts to drastically drop air quality. Air quality still dropped to Very Unhealthy levels in Longmont yesterday due to the smoke trapped in the boundary layer. The smoke that made it up into the free atmosphere created beautiful sunsets for Kansas and Oklahoma.

Colorado large wildfire update (as of 10:50AM on InciWeb):
Cameron Peak in the Medicine Bow Mountains: 59,051 acres; 4% contained (explosive increase in size, drop in containment)
Williams Fork in the Arapaho National Forest: 12,132 acres; 10% contained
Grizzly Creek in Glenwood Canyon: 32,464 acres; 83% contained
Pine Gulch north of Grand Junction: 139,007 acres; 87% contained

For rain estimates in your area over the last 24 to 72 hours, check out our State Precipitation Map below.

Click Here For Map Overview

The map below shows radar-estimated, rainfall gage-adjusted Quantitative Precipitation Estimates (QPE) across Colorado. The map is updated daily during the operational season (May 1 – Sep 30) by 11AM. The following six layers are currently available: 24-hour, 48-hour and 72-hour total precipitation, as well as maximum 1-hour, 2-hour and 6-hour precipitation over the past 24 hour period (to estimate where flash flooding may have occurred). The 24-hour, 48-hour and 72-hour total precipitation contain bias corrections that are not disaggregated into the hourly estimates, so there will likely be some differences. The accumulation ending time is 7AM of the date shown in the bottom right corner. Also shown optionally are vulnerable fire burn areas (post 2012), which are updated throughout the season to include new, vulnerable burn areas. The home button in the top left corner resets the map to the original zoom.

SPM 09-06-2020: Hot, Dry, and Smoky

Issue Date: Sunday, September 6th, 2020
Issue Time: 9:00AM MDT

Summary:

It was a hot one yesterday statewide, and Denver broke the September high temperature record as the mercury hit 101F. Several other stations across the state broke high temperature records as well. Hard to believe the change that’s on its way, but not before some more ridiculous, September heat. Not much rainfall except for maybe some sprinkles over the southern mountains, but none of the major precipitation networks recorded any rainfall. The Cameron Peak fire had some explosive growth yesterday as it moved into a new area of dry fuels. There were gusts recorded between 15 and 25 mph yesterday at the RAWS station at Cameron Pass, and a pyrocumulus cloud could be seen from Denver. Ash was reported over the adjacent plain communities, which include Fort Collins and Greeley. Faster surface winds today and hot, dry conditions will likely not be good for fire growth. That cool air and snowfall can’t get here fast enough for the ongoing fires.

Colorado large wildfire update (as of 8:45AM on InciWeb):
Cameron Peak in the Medicine Bow Mountains: 34,289 acres; 6% contained
Williams Fork in the Arapaho National Forest: 12,125 acres; 10% contained
Pine Gulch north of Grand Junction: 139,007 acres; 87% contained
Grizzly Creek in Glenwood Canyon: 32,464 acres; 83% contained

To see precipitation estimates over your area the last 24 to 72-hours, scroll down to the State Precipitation Map below.

Click Here For Map Overview

The map below shows radar-estimated, rainfall gage-adjusted Quantitative Precipitation Estimates (QPE) across Colorado. The map is updated daily during the operational season (May 1 – Sep 30) by 11AM. The following six layers are currently available: 24-hour, 48-hour and 72-hour total precipitation, as well as maximum 1-hour, 2-hour and 6-hour precipitation over the past 24 hour period (to estimate where flash flooding may have occurred). The 24-hour, 48-hour and 72-hour total precipitation contain bias corrections that are not disaggregated into the hourly estimates, so there will likely be some differences. The accumulation ending time is 7AM of the date shown in the bottom right corner. Also shown optionally are vulnerable fire burn areas (post 2012), which are updated throughout the season to include new, vulnerable burn areas. The home button in the top left corner resets the map to the original zoom.