Issue Date: Tuesday, September 8th, 2020
Issue Time: 11:00AM MDT
Summary:
Yesterday started out hot, dry, and smoky but ended chilly and wet. Abundant smoke across the state yesterday kept high temperatures down a few degrees, with Denver and Grand Junction only getting into the low 90Fs. However, locations in the Southeast Plains were still able to get up to the 100F mark where there was less smoke coverage. This quickly changed as a cold front came barreling through the plains of eastern Colorado earlier than expected, passing through Denver around 5PM. A 56 mph wind gust was recorded in Pueblo, CO as the front moved through around 9PM. A couple more surges of colder air moved into the plains overnight, which created upslope flow and allowed rain (plains) and snow (foothills/mountains) to fall. The highest precipitation totals up to 1.0 inch this morning are over the Northeast Plains, where some weak convection was able to generate some heavier rainfall. No flooding was reported with this heavier rain. Elsewhere, totals were generally 0.5 inches or less. Snowfall up to 2.5 inches was reported in the foothills of the Front Range, with 0.4 to 0.5 inches of liquid-equivalent precipitation (a 5:1 snow:liquid ratio). This precipitation and snowcover will hopefully suppress the wildfires, especially the Cameron Peak fire, which has exploded over the holiday weekend (see details below).
Colorado large wildfire update (as of 11:00AM on InciWeb):
Cameron Peak in the Medicine Bow Mountains: 102,596 acres; 4% contained (explosive increase in size)
Williams Fork in the Arapaho National Forest: 12,157 acres; 10% contained
Grizzly Creek in Glenwood Canyon: 32,464 acres; 91% contained (increased containment)
Pine Gulch north of Grand Junction: 139,007 acres; 87% contained
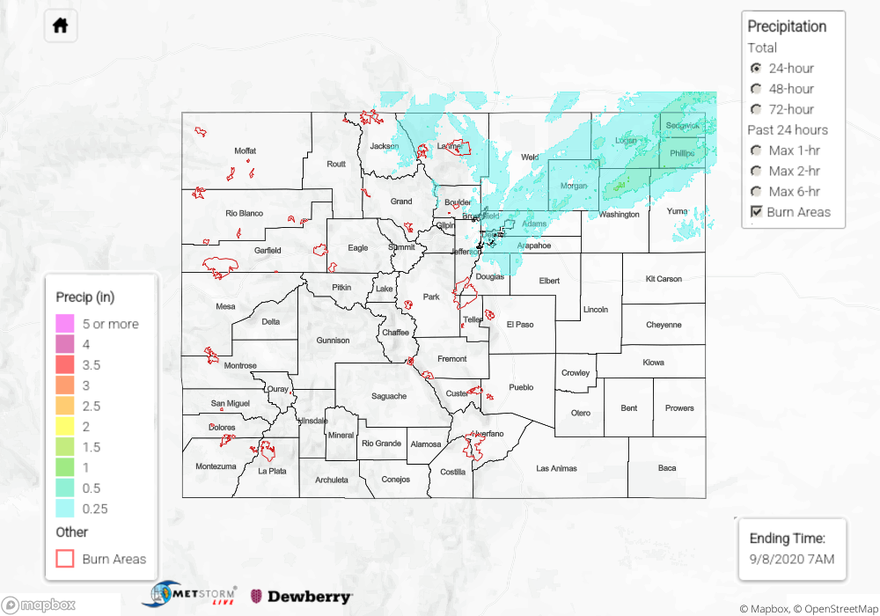
For precipitation estimates in your area over the last 24 hours, check out our State Precipitation Map below. Note that some of this precipitation likely fell as snow at higher elevation locations.
Click Here For Map Overview