Issue Date: Sunday, September 6th, 2020
Issue Time: 9:00AM MDT
Summary:
It was a hot one yesterday statewide, and Denver broke the September high temperature record as the mercury hit 101F. Several other stations across the state broke high temperature records as well. Hard to believe the change that’s on its way, but not before some more ridiculous, September heat. Not much rainfall except for maybe some sprinkles over the southern mountains, but none of the major precipitation networks recorded any rainfall. The Cameron Peak fire had some explosive growth yesterday as it moved into a new area of dry fuels. There were gusts recorded between 15 and 25 mph yesterday at the RAWS station at Cameron Pass, and a pyrocumulus cloud could be seen from Denver. Ash was reported over the adjacent plain communities, which include Fort Collins and Greeley. Faster surface winds today and hot, dry conditions will likely not be good for fire growth. That cool air and snowfall can’t get here fast enough for the ongoing fires.
Colorado large wildfire update (as of 8:45AM on InciWeb):
Cameron Peak in the Medicine Bow Mountains: 34,289 acres; 6% contained
Williams Fork in the Arapaho National Forest: 12,125 acres; 10% contained
Pine Gulch north of Grand Junction: 139,007 acres; 87% contained
Grizzly Creek in Glenwood Canyon: 32,464 acres; 83% contained
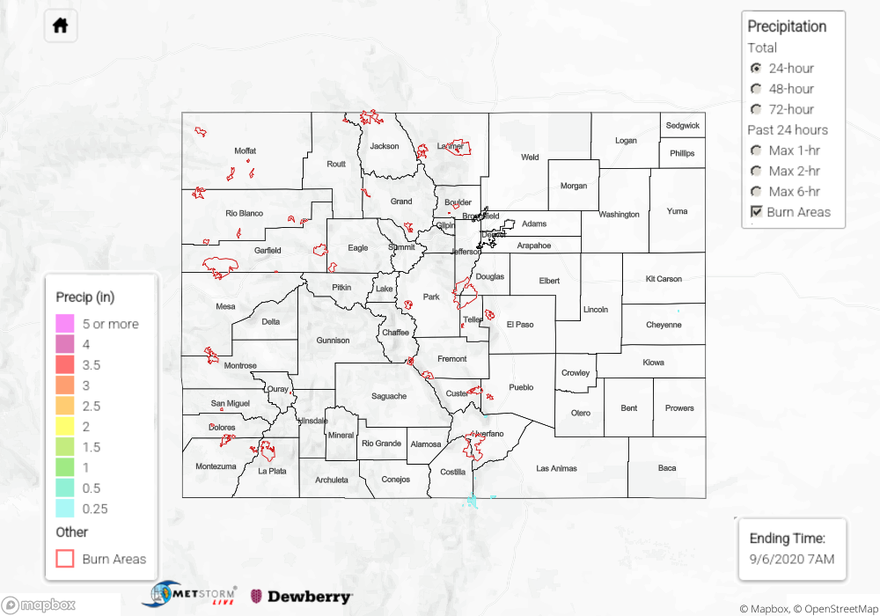
To see precipitation estimates over your area the last 24 to 72-hours, scroll down to the State Precipitation Map below.
Click Here For Map Overview
The map below shows radar-estimated, rainfall gage-adjusted Quantitative Precipitation Estimates (QPE) across Colorado. The map is updated daily during the operational season (May 1 – Sep 30) by 11AM. The following six layers are currently available: 24-hour, 48-hour and 72-hour total precipitation, as well as maximum 1-hour, 2-hour and 6-hour precipitation over the past 24 hour period (to estimate where flash flooding may have occurred). The 24-hour, 48-hour and 72-hour total precipitation contain bias corrections that are not disaggregated into the hourly estimates, so there will likely be some differences. The accumulation ending time is 7AM of the date shown in the bottom right corner. Also shown optionally are vulnerable fire burn areas (post 2012), which are updated throughout the season to include new, vulnerable burn areas. The home button in the top left corner resets the map to the original zoom.