SPM 05-03-2021: Wild Spring Weather Across Colorado

Issue Date: Monday, May 3, 2021
Issue Time: 10:45 am MDT

Summary

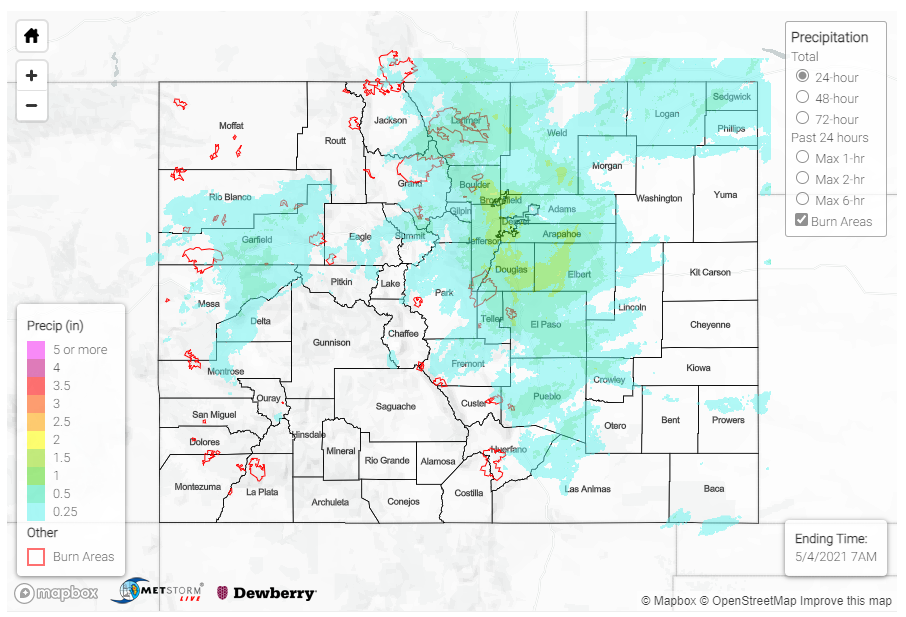
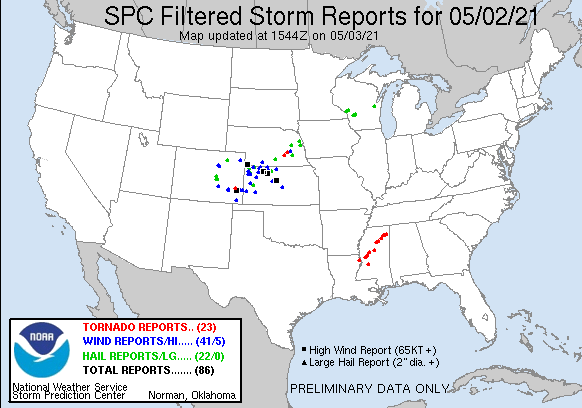
Yesterday had a little bit of everything across the state of Colorado! Heavy snow was forecasted for the central mountains, and many SNOTEL stations (high elevation, mountain stations) picked up over half an inch of new liquid precipitation. Thunderstorms produced localized heavy rain, high winds, and pea-sized (0.25”) to over quarter-sized (1.00”) hail, all the way from Grand Junction to Lamar. The Boulder WFO issued flood warnings and advisories yesterday for portions of Larimer and Boulder counties around the Cameron Peak, Calwood, and East Troublesome burn areas, however there were no local reports of flooding. A tornado was even reported by a trained spotter west of Wiley, CO, which can be seen along with some of the large hail reports in the map below from the Storm Prediction Center.

Flooding was not reported on Sunday. For rainfall estimates in your area, check out our State Precipitation Map below.

Click Here For Map Overview

The map below shows radar-estimated, rainfall gage-adjusted Quantitative Precipitation Estimates (QPE) across Colorado. The map is updated daily during the operational season (May 1 – Sep 30) by 11AM. The following six layers are currently available: 24-hour, 48-hour and 72-hour total precipitation, as well as maximum 1-hour, 2-hour and 6-hour precipitation over the past 24 hour period (to estimate where flash flooding may have occurred). The accumulation ending time is 7AM of the date shown in the bottom right corner. Also shown optionally are vulnerable fire burn areas (post 2012), which are updated throughout the season to include new, vulnerable burn areas. The home button in the top left corner resets the map to the original zoom.

Note: The 24-hour, 48-hour and 72-hour total precipitation do not contain bias corrections today due to errors in the CoCoRaHS data. This means there may be underestimations in QPE over the southwest and southeast corners of the state.
SPM 05-02-2021: Isolated and Gusting Thunderstorms

Issue Date: Sunday, May 2, 2021
Issue Time: 9:35 am MDT

Summary

The start of May and flood season saw an unseasonably warm and beautiful day, but also the start of a breakdown in the high-pressure systems dominating Colorado’s weather. A low-pressure system and associated cold front began pushing eastward across the state from the Utah border. With it, this system brought cooler temperatures and increased cloud cover, as well as isolated thunderstorms and gusty winds ahead of the front. High winds were reported from Dinosaur National Monument in northwestern Colorado, all the way to Broomfield-Jefferson County Airport on the Front Range. Strong winds can increase fire danger, and the Grand Junction, Pueblo, and Goodland, KS Weather Forecast Offices all issued Red Flag warnings for portions of the state yesterday.

In terms of precipitation amounts, CoCoRaHS observers across the state reported trace to 0.19” of precipitation associated with isolated storms, and some SNOTEL stations picked up as much as 0.2” of new precipitation at high elevations as well. Saturday was just the start of some exciting weather though, with heavy mountain snow likely and the chance for severe thunderstorms on the eastern plains to close out the weekend.

Flooding was not reported on Saturday. For rainfall estimates in your area, check out our State Precipitation Map below.

Click Here For Map Overview

The map below shows radar-estimated, rainfall gage-adjusted Quantitative Precipitation Estimates (QPE) across Colorado. The map is updated daily during the operational season (May 1 – Sep 30) by 11AM. The following six layers are currently available: 24-hour, 48-hour and 72-hour total precipitation, as well as maximum 1-hour, 2-hour and 6-hour precipitation over the past 24 hour period (to estimate where flash flooding may have occurred). The accumulation ending time is 7AM of the date shown in the bottom right corner. Also shown optionally are vulnerable fire burn areas (post 2012), which are updated throughout the season to include new, vulnerable burn areas. The home button in the top left corner resets the map to the original zoom.

SPM 05-01-2021: Clear Skies and a Look at this Season’s Snowpack

Issue Date: Saturday, May 1, 2021
Issue Time: 9:49 am MDT

Summary:

The end of April came and went uneventfully across the state of Colorado. There was no precipitation recorded across the state yesterday, as high-pressure systems kept the weather warm and dry.  No flooding was reported on Friday. For rainfall estimates in your area, check out our State Precipitation Map below.

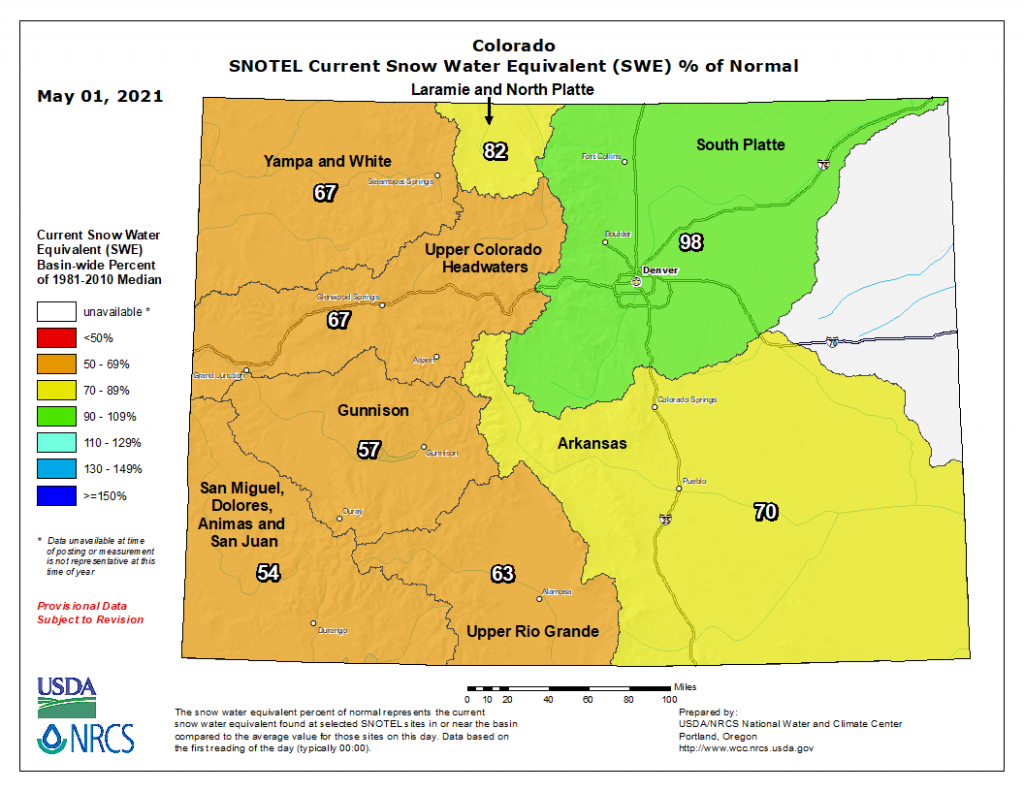
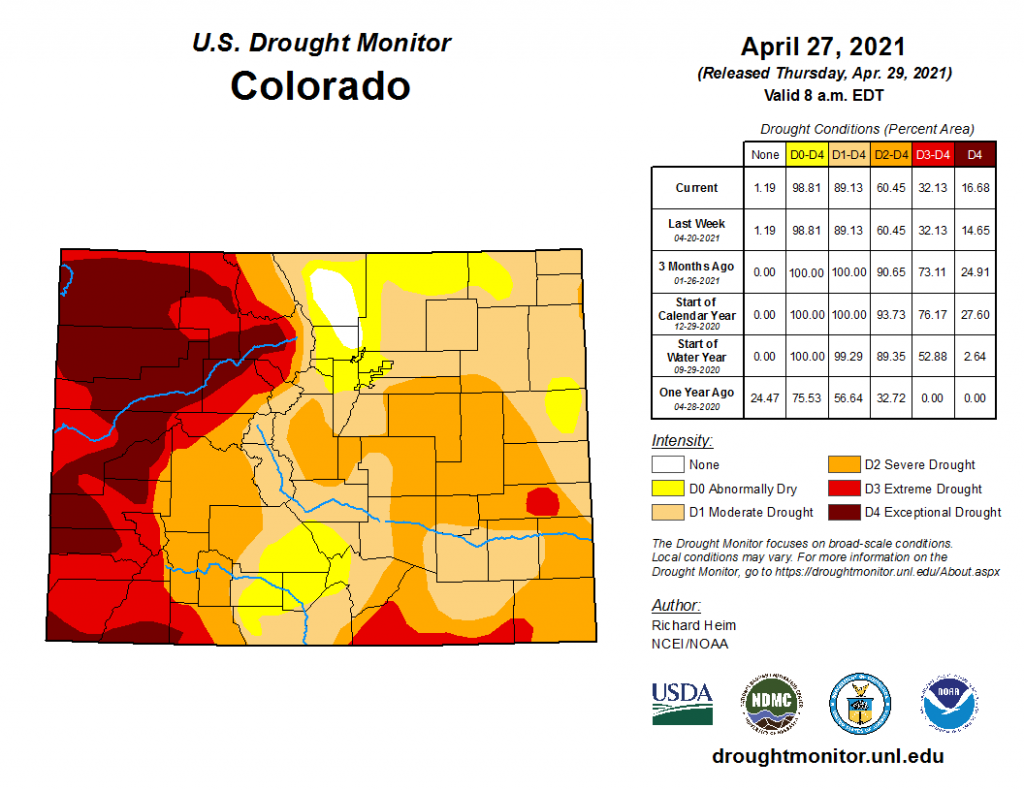
As flood seasons begins, let’s take a look at the state of snowpack across Colorado. This is provided in the first map below from the National Water and Climate Center as Snow Water Equivalent (SWE). The good news first, the South Platte basin is hovering right around normal for this time of year, thanks to several large snow events that blanketed the Northern Front Range in March and April. However, the rest of Colorado is in much worse shape in terms of snowpack. Basins along the western slope have less than 70% compared to 1981-2010 averages, and severe to exceptional drought conditions are present across the Western Slope, as seen in the second map from the U.S. Drought Monitor.  Drought is one of the many factors that can affect the severity of fire season, something important to remember after the extreme fire season in late 2020. A change in the weather pattern over the weekend is anticipated to bring some much-needed moisture across the state, and hopefully boosting the snowpack totals closer to normal.


Click Here For Map Overview

The map below shows radar-estimated, rainfall gage-adjusted Quantitative Precipitation Estimates (QPE) across Colorado. The map is updated daily during the operational season (May 1 – Sep 30) by 11AM. The following six layers are currently available: 24-hour, 48-hour and 72-hour total precipitation, as well as maximum 1-hour, 2-hour and 6-hour precipitation over the past 24 hour period (to estimate where flash flooding may have occurred). The 24-hour, 48-hour and 72-hour total precipitation contain bias corrections that are not disaggregated into the hourly estimates, so there will likely be some differences. The accumulation ending time is 7AM of the date shown in the bottom right corner. Also shown optionally are vulnerable fire burn areas (post 2012), which are updated throughout the season to include new, vulnerable burn areas. The home button in the top left corner resets the map to the original zoom.

SPM 09-30-2020: Smoky Skies with No Precipitation

Issue Date: Wednesday, September 30th, 2020
Issue Time: 10:30AM MDT

Summary:

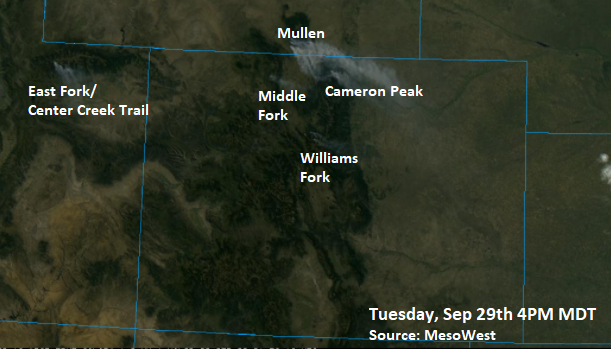
Below is the visible satellite imagery from 4PM yesterday. All large ongoing fires have visible smoke plumes, including the Williams Fork fire. This likely is helping to contribute to the smoke being reported in the Denver Metro this morning. In fact, smoke is visible across the entire I-25 corridor (gray hue): CLICK ME. Ash and soot has been observed further north within the Urban Corridor. Low air quality is forecast again today along the I-25 Corridor.

The image below also shows cloud free conditions, which meant that no precipitation fell. The stronger surface winds yesterday, associated with the upper jet, were located over the northern Northeast Plains, which caused elevated fire danger. Northwest winds were in the 10 to 20 mph range with gusts up to 28 mph observed. It also got windy over the higher elevations along and near the northern Continental Divide, and northwest wind gusts up to 25 to 30 mph were observed. This likely helped flare up the Williams Fork fire, which is why we saw an increase in smoke yesterday afternoon.

Large ongoing Colorado wildfires update (as of 9:30AM from InciWeb):
Cameron Peak in the Medicine Bow Mountains: 125,006 acres; 22% contained
Middle Fork Fire in Routt County: 7,897 acres; 0% containment
Williams Fork in the Arapaho National Forest: 12,898 acres; 14% contained

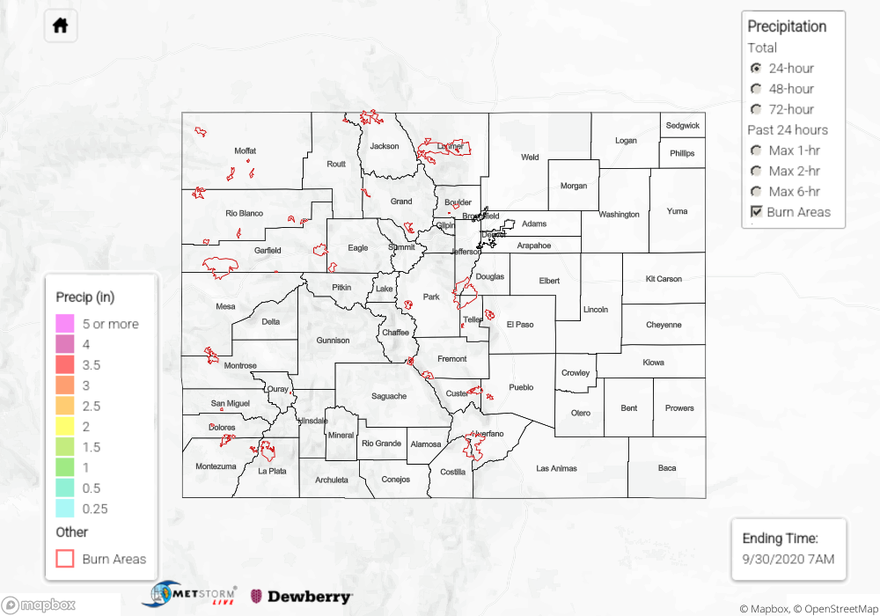
To see precipitation estimates over your neighborhood the last 24 to 72-hours, scroll down to the State Precipitation Map below.

Click Here For Map Overview

The map below shows radar-estimated, rainfall gage-adjusted Quantitative Precipitation Estimates (QPE) across Colorado. The map is updated daily during the operational season (May 1 – Sep 30) by 11AM. The following six layers are currently available: 24-hour, 48-hour and 72-hour total precipitation, as well as maximum 1-hour, 2-hour and 6-hour precipitation over the past 24 hour period (to estimate where flash flooding may have occurred). The 24-hour, 48-hour and 72-hour total precipitation contain bias corrections that are not disaggregated into the hourly estimates, so there will likely be some differences. The accumulation ending time is 7AM of the date shown in the bottom right corner. Also shown optionally are vulnerable fire burn areas (post 2012), which are updated throughout the season to include new, vulnerable burn areas. The home button in the top left corner resets the map to the original zoom.