Issue Date: Wednesday, September 30th, 2020
Issue Time: 10:30AM MDT
Summary:
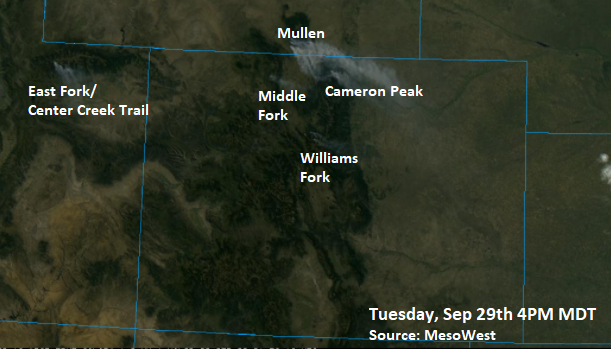
Below is the visible satellite imagery from 4PM yesterday. All large ongoing fires have visible smoke plumes, including the Williams Fork fire. This likely is helping to contribute to the smoke being reported in the Denver Metro this morning. In fact, smoke is visible across the entire I-25 corridor (gray hue): CLICK ME. Ash and soot has been observed further north within the Urban Corridor. Low air quality is forecast again today along the I-25 Corridor.
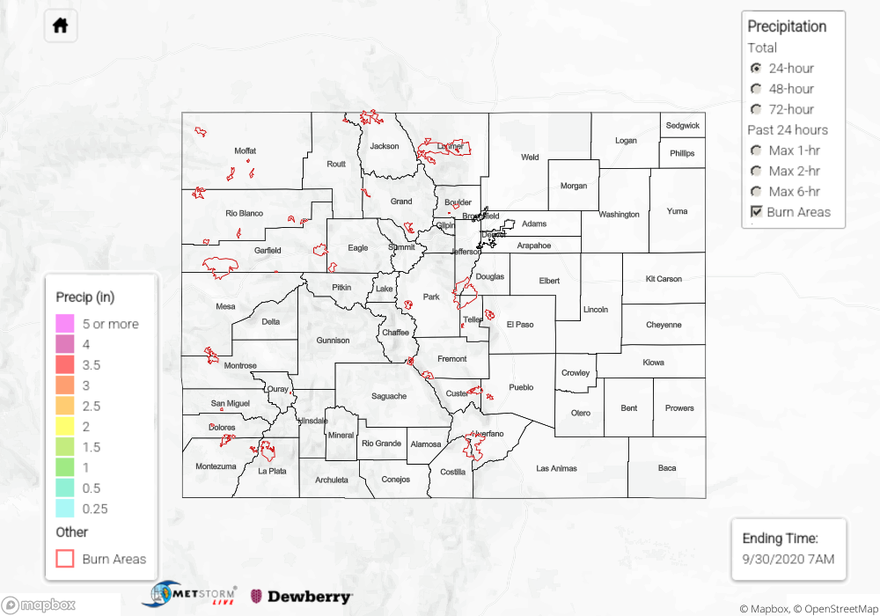
The image below also shows cloud free conditions, which meant that no precipitation fell. The stronger surface winds yesterday, associated with the upper jet, were located over the northern Northeast Plains, which caused elevated fire danger. Northwest winds were in the 10 to 20 mph range with gusts up to 28 mph observed. It also got windy over the higher elevations along and near the northern Continental Divide, and northwest wind gusts up to 25 to 30 mph were observed. This likely helped flare up the Williams Fork fire, which is why we saw an increase in smoke yesterday afternoon.

Large ongoing Colorado wildfires update (as of 9:30AM from InciWeb):
Cameron Peak in the Medicine Bow Mountains: 125,006 acres; 22% contained
Middle Fork Fire in Routt County: 7,897 acres; 0% containment
Williams Fork in the Arapaho National Forest: 12,898 acres; 14% contained
To see precipitation estimates over your neighborhood the last 24 to 72-hours, scroll down to the State Precipitation Map below.
Click Here For Map Overview
