Issue Date: Saturday, May 1, 2021
Issue Time: 9:49 am MDT
Summary:
The end of April came and went uneventfully across the state of Colorado. There was no precipitation recorded across the state yesterday, as high-pressure systems kept the weather warm and dry. No flooding was reported on Friday. For rainfall estimates in your area, check out our State Precipitation Map below.
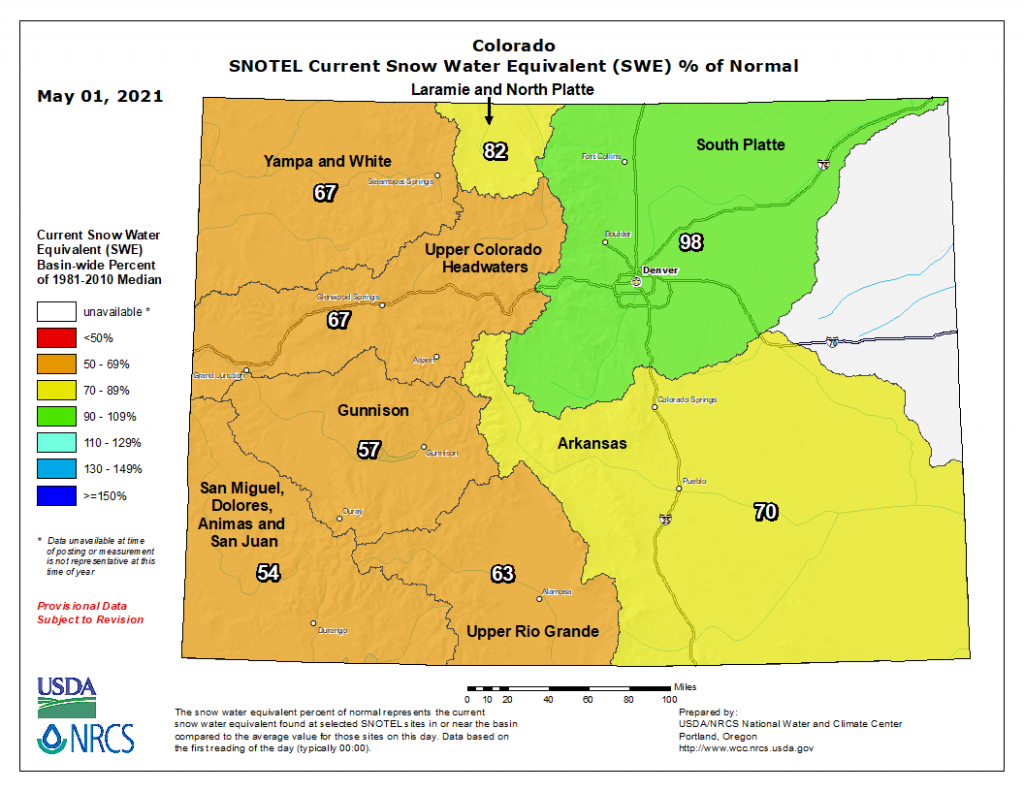
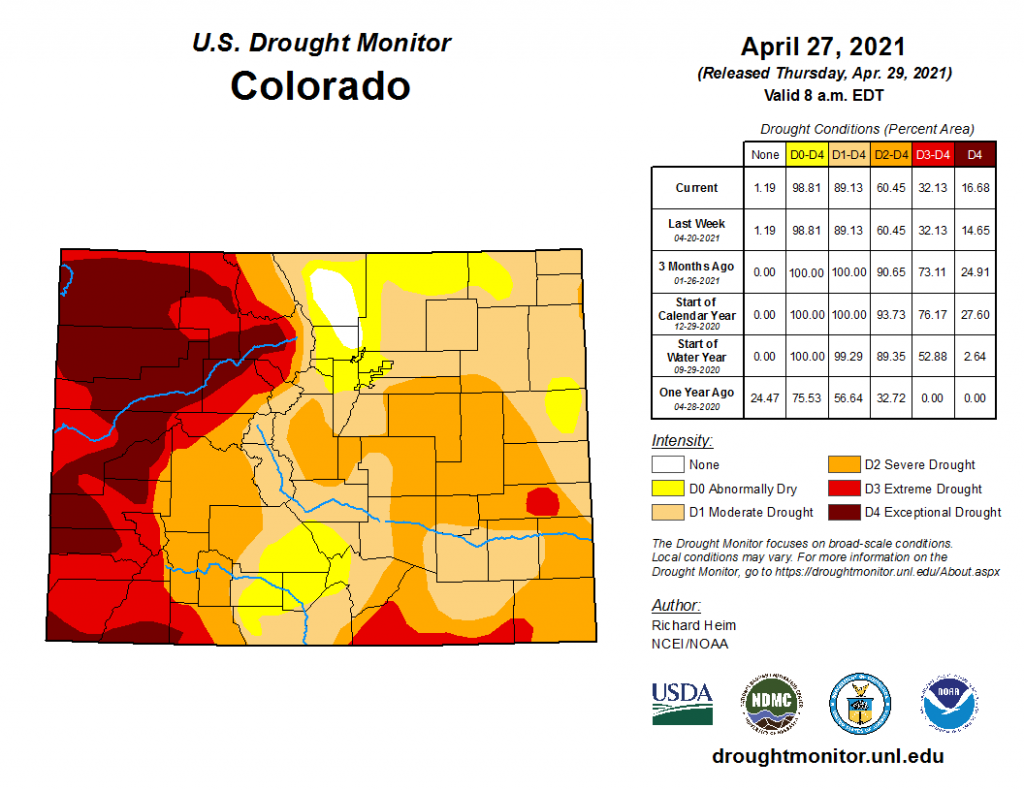
As flood seasons begins, let’s take a look at the state of snowpack across Colorado. This is provided in the first map below from the National Water and Climate Center as Snow Water Equivalent (SWE). The good news first, the South Platte basin is hovering right around normal for this time of year, thanks to several large snow events that blanketed the Northern Front Range in March and April. However, the rest of Colorado is in much worse shape in terms of snowpack. Basins along the western slope have less than 70% compared to 1981-2010 averages, and severe to exceptional drought conditions are present across the Western Slope, as seen in the second map from the U.S. Drought Monitor. Drought is one of the many factors that can affect the severity of fire season, something important to remember after the extreme fire season in late 2020. A change in the weather pattern over the weekend is anticipated to bring some much-needed moisture across the state, and hopefully boosting the snowpack totals closer to normal.
Click Here For Map Overview


