SPM 06-04-2021: Scattered PM Storms Helped Produce SLV Dust Storm

Issue Date: Friday, June 4th, 2021
Issue Time: 9:05AM MDT

Summary:

It was quite the warm day on Thursday. High temperatures were on the rise as the ridge continued to strengthen, and afternoon temperatures reached 1 to 5F higher than Wednesday. A little bit of moisture was present under the ridge (south) that originated from a disturbance over the Gulf of Mexico. This helped spark afternoon storms over the southern high terrains with the diurnal flow pattern. Steering flow fairly quickly from the NNE, a dry surface layer and small storm cores limited rainfall accumulation and kept storms mostly confined to the mountains. Storm totals (west) up to 0.30 inches were reported (Upper Rio Grande SNOTEL) and 0.11 inches east (La Veta Pass ASOS). Further north, storms produced less than 0.10 inches. Storms began to wane and fade away just after sundown.

Rather than rainfall, the main threat from storms were lightning and outflow winds. Around 5:30PM, there was a dust storm reported in the San Luis Valley that was triggered by these dissipating thunderstorms. A wall of dust extended from 19 miles southeast of Wolf Creek Pass to Alamosa near Blanca. The KLAS (Alamosa) airport ASOS recorded a gust of 35 mph and sustained winds just over 25 mph, which more than likely briefly dropped visibility to less than a mile. There’s a picture of the dust wall from Wilt Chamberlain at 5:20PM on Twitter (click me). It was taken at the intersection of 8 South and 106 South – just southwest of Alamosa.

As anticipated, flooding was not reported on Thursday. To see precipitation estimates over your neighborhood the last 24 to 72-hours, scroll down to the State Precipitation Map below.

Click Here For Map Overview

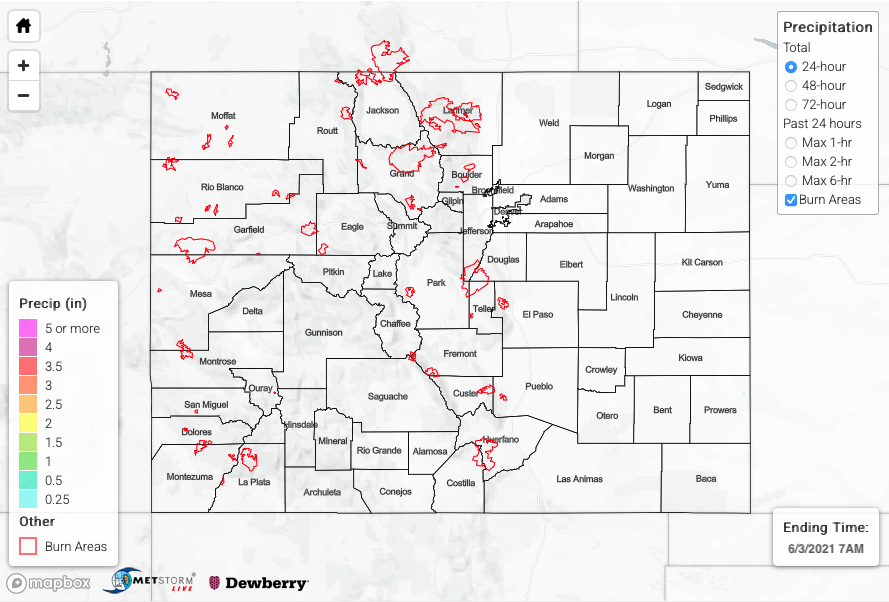
The map below shows radar-estimated, rainfall gage-adjusted Quantitative Precipitation Estimates (QPE) across Colorado. The map is updated daily during the operational season (May 1 – Sep 30) by 11AM. The following six layers are currently available: 24-hour, 48-hour and 72-hour total precipitation, as well as maximum 1-hour, 2-hour and 6-hour precipitation over the past 24 hour period (to estimate where flash flooding may have occurred). The 24-hour, 48-hour and 72-hour total precipitation contain bias corrections that are not disaggregated into the hourly estimates, so there will likely be some differences. The accumulation ending time is 7AM of the date shown in the bottom right corner. Also shown optionally are vulnerable fire burn areas (post 2012), which are updated throughout the season to include new, vulnerable burn areas. The home button in the top left corner resets the map to the original zoom.

SPM 06-03-2021: Limited Precipitation and Drought Monitor Update

Issue Date: Thursday, June 3, 2021
Issue Time: 9:00 am MDT

Summary

High pressure settled in west of the state yesterday, which brought warm temperatures and limited precipitation. There were some isolated evening storms in the San Juan Mountains, San Luis Valley, and Southeast Mountains, but they produced very little rainfall. There were no severe weather reports in Colorado yesterday. For rainfall estimates in your area, check out the State Precipitation Map at the bottom of this post.

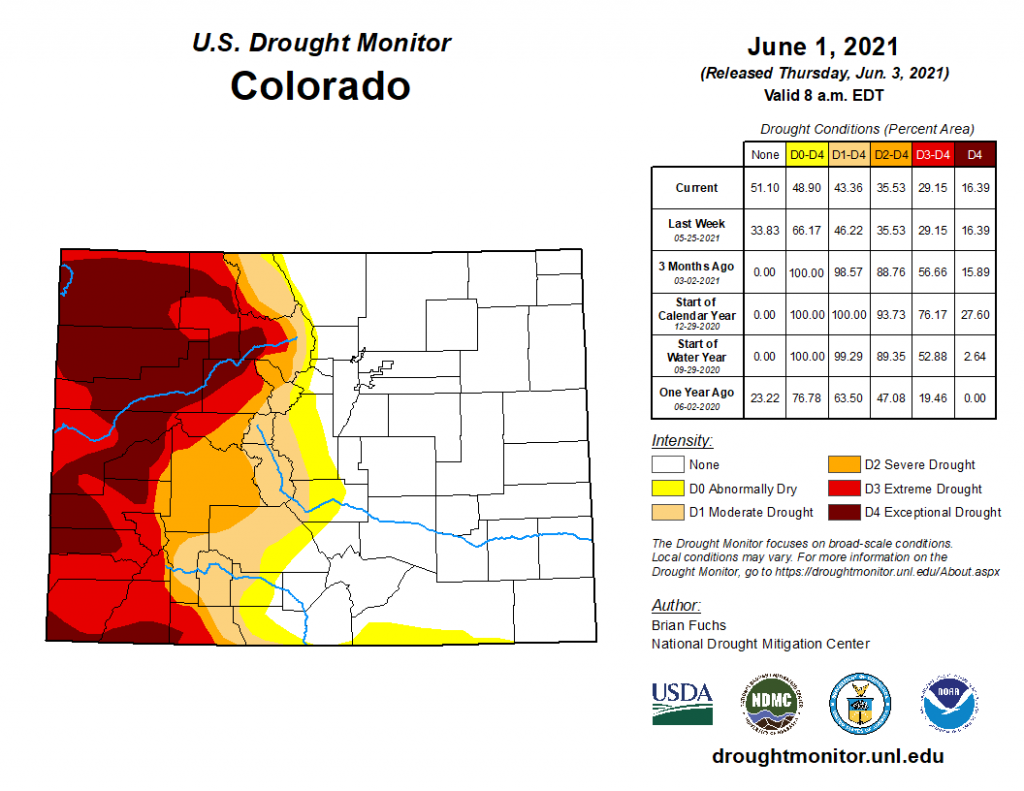
The updated U.S. Drought Monitor was published this morning, reflective of conditions up until June 1, 2021, as seen in the map below. There is an impressive divide in drought conditions between the eastern and western halves of the state. Drought conditions continued to improve in Eastern Colorado, where over 51% of the state is experiencing no drought conditions at all. This is in sharp contrast to the west, where there are still large areas of extreme to exceptional drought in the Northwest and Southwest Slopes and Grand Valley.

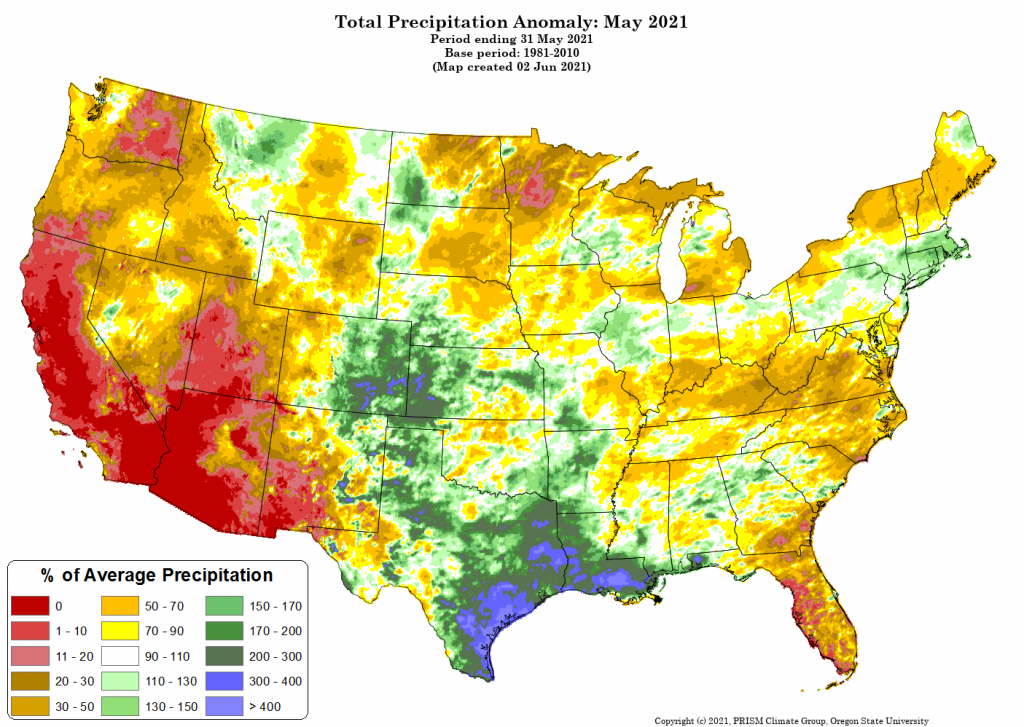
The drastic differences between east and west of the divide is no surprise considering the very different spring weather each has been experiencing. The map below from PRISM shows the total precipitation anomaly for May 2021 compared to 1981-2010 May climate normals. Eastern Colorado, especially the southeast, received well above normal precipitation for this time of year, including some portions that received over 300% of normal precipitation! Compare this to Western Colorado, where some places received only 30-50% of normal May rain.

Click Here For Map Overview

The map below shows radar-estimated, rainfall gage-adjusted Quantitative Precipitation Estimates (QPE) across Colorado. The map is updated daily during the operational season (May 1 – Sep 30) by 11AM. The following six layers are currently available: 24-hour, 48-hour and 72-hour total precipitation, as well as maximum 1-hour, 2-hour and 6-hour precipitation over the past 24 hour period (to estimate where flash flooding may have occurred). The accumulation ending time is 7AM of the date shown in the bottom right corner. Also shown optionally are vulnerable fire burn areas (post 2012), which are updated throughout the season to include new, vulnerable burn areas. The home button in the top left corner resets the map to the original zoom.

SPM 06-02-2021: Flooding Over Cameron Peak Burn Scar

Issue Date: Wednesday, June 2, 2021
Issue Time: 10:15 am MDT

Summary

Storms began to develop over high elevations in the late morning and early afternoon yesterday, before making their way eastward and tapping into additional available moisture. Several severe thunderstorms warnings were issued for the Eastern Plains. The largest threats from these storms were localized heavy rainfall and large hail, including a 1.75 inch hail report in Fort Morgan in Morgan County. Tuesday also marked the 4th day in a row in which a funnel cloud or tornado was reported in Colorado, this time in Bethune in Kit Carson County. For rainfall estimates in your area, check out the State Precipitation Map at the bottom of today’s post.

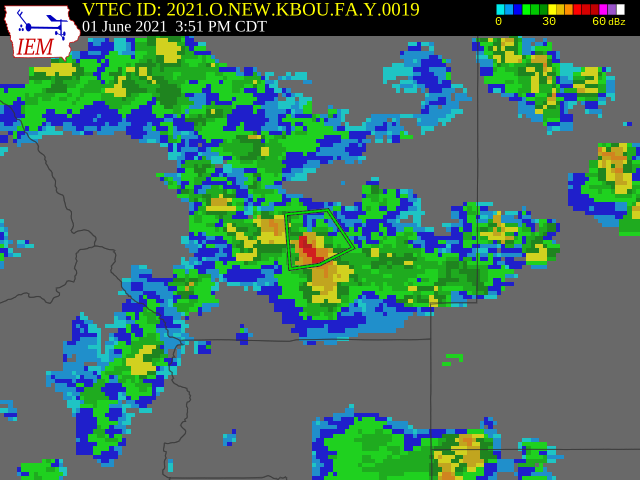
As seen in the Fire Burn Forecast, flooding was reported over the Cameron Peak burn scar yesterday. A flood advisory was issued in Larimer County for the Cameron Peak burn scar at 2:51 pm after Doppler radar indicated heavy rain from thunderstorms, which is seen in the area of higher (red) reflectivity in the warning polygon in the map below (note the time on the map is Central Daylight Time). Around this time, a CoCoRaHS observer in Drake, at the southeast edge of the burn scar, reported high intensity rainfall and ash and debris movement consistent with burn scar flooding. Their full comment is below:

“Heavy rain and hail produced .39″ in the rain gauge during a 25 minute window between 2:35PM and 3:00PM. Ash and debris movement from Cameron Peak Fire caused a culvert in our driveway to plug up with sand and consequently overflow and washout our driveway. There is a 3′ basin to capture water before the culvert. It was clear prior to the storm except for a small pile of pine needles in the ditch that I hadn’t cleaned out. The 3′ basin is now filled with ash, sand, rocks and pine needles. The driveway is covered in pine needles as well.”

Click Here For Map Overview

The map below shows radar-estimated, rainfall gage-adjusted Quantitative Precipitation Estimates (QPE) across Colorado. The map is updated daily during the operational season (May 1 – Sep 30) by 11AM. The following six layers are currently available: 24-hour, 48-hour and 72-hour total precipitation, as well as maximum 1-hour, 2-hour and 6-hour precipitation over the past 24 hour period (to estimate where flash flooding may have occurred). The accumulation ending time is 7AM of the date shown in the bottom right corner. Also shown optionally are vulnerable fire burn areas (post 2012), which are updated throughout the season to include new, vulnerable burn areas. The home button in the top left corner resets the map to the original zoom.

Note: The 24-hour, 48-hour and 72-hour total precipitation do not contain bias corrections today. This means there may be underestimations in QPE over the southwest and southeast corners of the state.

SPM 06-01-2021: Thunderstorms Across Southern Colorado

Issue Date: Tuesday, June 1, 2021
Issue Time: 9:00 am MDT

Summary

Yesterday was an active day for Southern Colorado and the Central Mountains. Thunderstorms began to develop in the Southwest Slope and San Juan Mountains in the late morning ahead of the trough moving eastward. The main threat from these storms was hail, with several reports of 0.5-1.0 inch hail in Durango and the surrounding area. A flash flood warning was also issued for the 416 burn area in La Plata county after Doppler radar indicated heavy rain over the area. Similarly, a flash flood warning was issued for the Williams Fork burn area in Grand Country. However, no flooding was reported on Monday and while many river gauges are above normal streamflow, none are currently in flood stage.

Heavy rain continued eastward across Southern Colorado through the day, 0.81” was reported near the Spanish Peaks northwest of Trinidad and 0.90” in Boone, CO east of Pueblo. Rainfall rates from these storms remained low enough due to limited instability to prevent flooding. For rainfall estimates in your area, check out our State Precipitation Map below.

Click Here For Map Overview

The map below shows radar-estimated, rainfall gage-adjusted Quantitative Precipitation Estimates (QPE) across Colorado. The map is updated daily during the operational season (May 1 – Sep 30) by 11AM. The following six layers are currently available: 24-hour, 48-hour and 72-hour total precipitation, as well as maximum 1-hour, 2-hour and 6-hour precipitation over the past 24 hour period (to estimate where flash flooding may have occurred). The accumulation ending time is 7AM of the date shown in the bottom right corner. Also shown optionally are vulnerable fire burn areas (post 2012), which are updated throughout the season to include new, vulnerable burn areas. The home button in the top left corner resets the map to the original zoom.