SPM 06-24-2021: Light Precipitation Overnight

Issue Date: Thursday, June 24, 2021
Issue Time: 9:00 AM MDT

Summary:

A widespread swath of Colorado saw some light, but much needed, rain yesterday. A pulse of monsoonal moisture arrived in the Southwest Slope and resulted in showers in the evening. This moisture was advected northeastward as the evening progressed into night, generally rotating around the surface low-pressure system located to the east of the state. The result was overnight showers in the San Juan, Central, and Northern Mountains, and finally the Front Range and Urban Corridor into the early morning hours.

Again, precipitation totals were generally light with these showers, but they did bring up to 0.15-0.18 inches to some locations, especially at high elevations. While this may not be apparent in the MetStorm Live grids displayed in the SPM, QPE estimates from NOAA show the spatial distribution of rainfall across the state yesterday, though likely with a high bias in terms of magnitude.
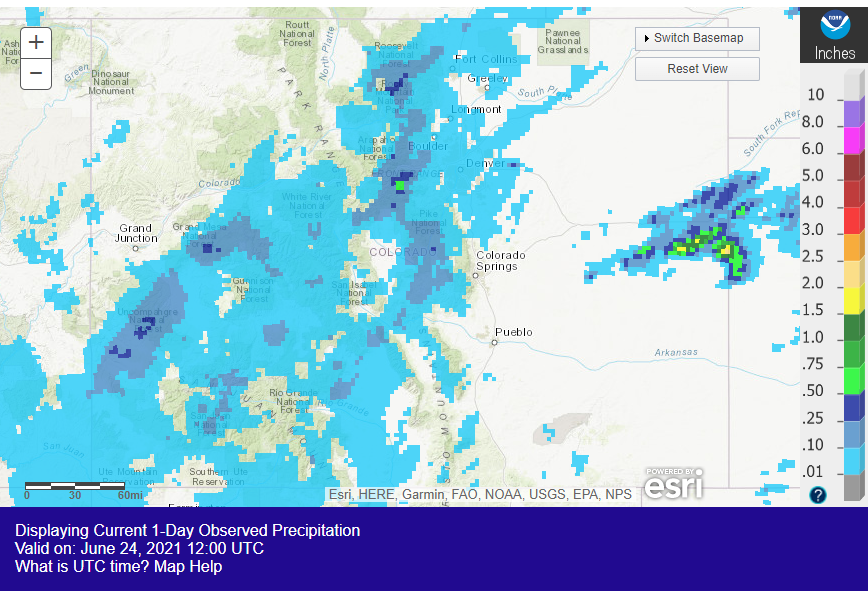
To the east, a cell developed in the late afternoon along the Palmer Ridge before pushing eastward (which can also be seen in the NOAA QPE, also likely biased high). As the storm approached the dryline on the Colorado-Kansas border, it was able to intensify and a severe thunderstorm warning was issued for high winds and large hail. No severe reports were ultimately made for this storm, possibly due to remote location away from observation locations.

No flooding was reported in Colorado on Wednesday. For rainfall estimates in your area, including antecedent conditions, check out the State Precipitation Map below.

Click Here For Map Overview

The map below shows radar-estimated, rainfall gage-adjusted Quantitative Precipitation Estimates (QPE) across Colorado. The map is updated daily during the operational season (May 1 – Sep 30) by 11AM. The following six layers are currently available: 24-hour, 48-hour and 72-hour total precipitation, as well as maximum 1-hour, 2-hour and 6-hour precipitation over the past 24 hour period (to estimate where flash flooding may have occurred). The 24-hour, 48-hour and 72-hour total precipitation contain bias corrections that are not disaggregated into the hourly estimates, so there will likely be some differences. The accumulation ending time is 7AM of the date shown in the bottom right corner. Also shown optionally are vulnerable fire burn areas (post 2012), which are updated throughout the season to include new, vulnerable burn areas. The home button in the top left corner resets the map to the original zoom.

SPM 06-23-2021: Return of Summer Heat

Issue Date: Wednesday, June 23, 2021
Issue Time: 8:45 AM MDT

Summary:

The persisting high pressure system kept the air dry across the state and limited precipitation to a few isolated storms on Tuesday. With it, the return of higher, more summer-like temperatures. Highs were 10-15 degrees hotter on Tuesday compared to the cool-down on Monday. No flooding was reported on Tuesday. For rainfall estimates in your area, including antecedent rainfall, check out the State Precipitation Map at the bottom of today’s post.

Wildfire smoke has been visible in the air from active fires within Colorado and the surrounding southwest states. The combined smoke and hot temperatures resulted in poorer air quality throughout the state due to ozone and particulate matter, especially in the Urban Corridor. Reed Timmer shared the following pictures on twitter of the wildfire smoke at sunset looking west along I-70 near Genesee. “Beautiful but troubling” is an appropirate description.

Click Here For Map Overview

The map below shows radar-estimated, rainfall gage-adjusted Quantitative Precipitation Estimates (QPE) across Colorado. The map is updated daily during the operational season (May 1 – Sep 30) by 11AM. The following six layers are currently available: 24-hour, 48-hour and 72-hour total precipitation, as well as maximum 1-hour, 2-hour and 6-hour precipitation over the past 24 hour period (to estimate where flash flooding may have occurred). The 24-hour, 48-hour and 72-hour total precipitation contain bias corrections that are not disaggregated into the hourly estimates, so there will likely be some differences. The accumulation ending time is 7AM of the date shown in the bottom right corner. Also shown optionally are vulnerable fire burn areas (post 2012), which are updated throughout the season to include new, vulnerable burn areas. The home button in the top left corner resets the map to the original zoom.

SPM 06-22-2021: Cool and Pleasant Summer Day

Issue Date: Tuesday, June 22, 2021
Issue Time: 9:30 AM MDT

Summary:

Monday was very calm in terms of precipitation. An early morning line of storms was present east of Limon along the I-70 corridor, before moving south and dissipating through morning, as mentioned in the FTB yesterday. Other than that, conditions remained dry across the state for the rest of the day. No flooding was reported on Monday. For rainfall estimates in your area, including antecedent conditions, check out the State Precipitation Map at the bottom of today’s post.

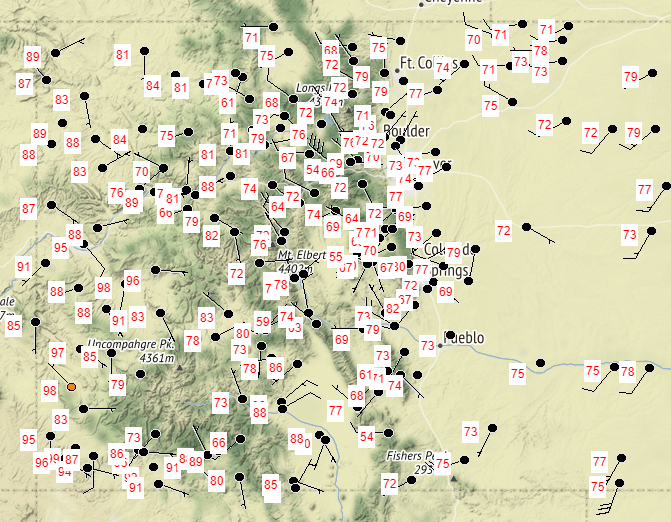
While astronomical summer technically started on Sunday, Monday felt much more like spring for some of the state. Cooler temperatures were left behind after the two cold frontal passages, with highs in the 60s for the high elevations and 70s for the Urban Corridor and Eastern Plains. The western half of the state wasn’t able to cool as much, and observed highs were in the 80s in the Northwest Slope and Grand Valley and well into the 90s in the Southwest Slope. Daily high temperatures across the state yesterday can be seen in the map below, with data populated from NWS and RAWS stations.

Click Here For Map Overview

The map below shows radar-estimated, rainfall gage-adjusted Quantitative Precipitation Estimates (QPE) across Colorado. The map is updated daily during the operational season (May 1 – Sep 30) by 11AM. The following six layers are currently available: 24-hour, 48-hour and 72-hour total precipitation, as well as maximum 1-hour, 2-hour and 6-hour precipitation over the past 24 hour period (to estimate where flash flooding may have occurred). The 24-hour, 48-hour and 72-hour total precipitation contain bias corrections that are not disaggregated into the hourly estimates, so there will likely be some differences. The accumulation ending time is 7AM of the date shown in the bottom right corner. Also shown optionally are vulnerable fire burn areas (post 2012), which are updated throughout the season to include new, vulnerable burn areas. The home button in the top left corner resets the map to the original zoom.

SPM 06-21-2021: Continued Rainy East – Dry West

Issue Date: Monday, June 21, 2021
Issue Time: 9:30 AM MDT

Summary:

Sunday saw widespread evening showers in the Eastern Plains and Palmer Ridge, which continued well into the night. There was plenty of moisture but limited instability, so rainfall rates remained low with these storms. A strong enough cell formed between Colorado Springs and Pueblo to warrant severe thunderstorm warnings, with large hail and damaging winds as the main threat, however no additional severe reports were made. No flooding was reported on Sunday. For rainfall estimates in your area, check out the State Precipitation Map below.

Out west, non-thunderstorm high winds were reported in the Western Slope, Grand Valley, and Northern Mountains, where fire danger was already elevated. Gusts exceeded 50 mph in Meeker, Steamboat Springs, and Glenwood Springs, and 49 mph in Cortez in the southwest. The ongoing lack of rain west of the divide continues to impact streamflow as well. According to the USGS National Water Dashboard for Colorado, a majority of gauges in the state are now “below” or “much below” normal for this time of year, with nearly all of the low gauges concentrated to the west.

Click Here For Map Overview

The map below shows radar-estimated, rainfall gage-adjusted Quantitative Precipitation Estimates (QPE) across Colorado. The map is updated daily during the operational season (May 1 – Sep 30) by 11AM. The following six layers are currently available: 24-hour, 48-hour and 72-hour total precipitation, as well as maximum 1-hour, 2-hour and 6-hour precipitation over the past 24 hour period (to estimate where flash flooding may have occurred). The 24-hour, 48-hour and 72-hour total precipitation contain bias corrections that are not disaggregated into the hourly estimates, so there will likely be some differences. The accumulation ending time is 7AM of the date shown in the bottom right corner. Also shown optionally are vulnerable fire burn areas (post 2012), which are updated throughout the season to include new, vulnerable burn areas. The home button in the top left corner resets the map to the original zoom.