SPM 07-22-2021: Flash Floods on East Troublesome and Hayden Pass Burn Scars

Issue Date: Thursday, July 22, 2021
Issue Time: 9:45 AM MDT

Summary:

Yesterday saw heavy rain across the State, but most significantly in the San Juan, Central, Northern and Front Range Mountains, as well some of the Urban Corridor and Palmer Ridge.

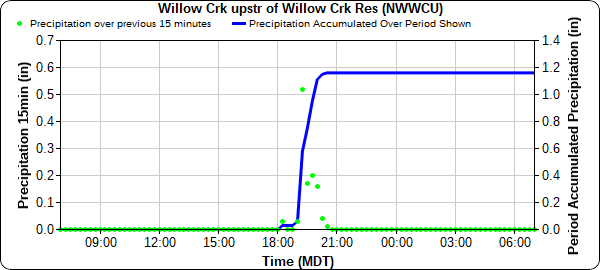
Flash flood warnings were issued for both the Cameron Peak and East Troublesome burn scars in the Northern Mountains. Multiple debris flows and flooding was reported over CO-125 in Grand County after heavy rain caused runoff on the East Troublesome burn scar and stranded travelers. The highway is still closed as of this morning. Over 1 inch of rain fell on the East Troublesome burn scar in a little under 2-hours, as seen in the time series plot from Willow Creek Reservoir.
Flooding was not reported from the Cameron Peak burn scar on Wednesday, though the river remains closed after deadly floods on Tuesday.

Another flash flood was reported in Coaldale, in Fremont County, on the Hayden Pass burn scar. Water and Debris from Butter Creek was reported on County Road 40. Rainfall observations around this area range from 0.65-0.85 inches.

A flash flood was reported in Westcliffe as well, though unrelated to a burn scar. Between 1.25-2.04 inches of rain was reported between CoCoRaHS observers and CoAgMet gauges. Street flooding occurred in town and Hermit Road was cut off from Highway 69 to 96 from flood waters. One CoCoRaHS observer, who recorded 2.03 inches, left the following remark:
This may be the biggest rain event I’ve recorded here. I filed both hail and significant weather reports yesterday. The storm seem to grow above us, first with cloud lightning, then high winds and driving rain, mixed with hail. It looked like hurricanes I’ve experienced. One of my hoop houses, very exposed to the south winds blew apart. Leaves on my beans there were stripped. Other leaf damage was widespread. Our front area flooded. Reports from in town showed overwhelmed street drains. I’ll get out soon to see how our gravel and dirt roads fared.

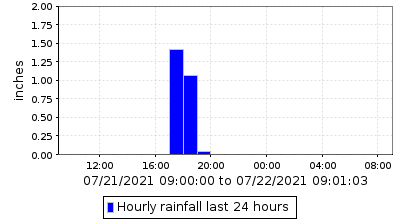
Along the Palmer Ridge over 2 inches of rain fell, including 2.52 inches in Southeast Douglas County picked up by a MHFD gauge, seen below. The Antelope Creek station had two hourly observations of 1.42 and 1.06 inches, for a 2-hour total of 2.48. According to Precipitation Frequency Estimates from NOAA Atlas 14 in this area. 1.42 inches in a single hour is greater than a 10-year rainfall event, and 2.48 inches in 2-hours is over a 50-year rainfall event!
Several locations across the Mountains and Palmer Ridge received nearly an inch of rain yesterday, including Floyd Hill, Silverthorne, Buena Vista, La Veta, and Capulin. Heavy rain and floods were not the only risk from storms yesterday – large hail, up to 0.70 inches, was reported in Pagosa Springs yesterday. For rainfall estimates in your area, check out the State Precipitation Map below.

Click Here For Map Overview
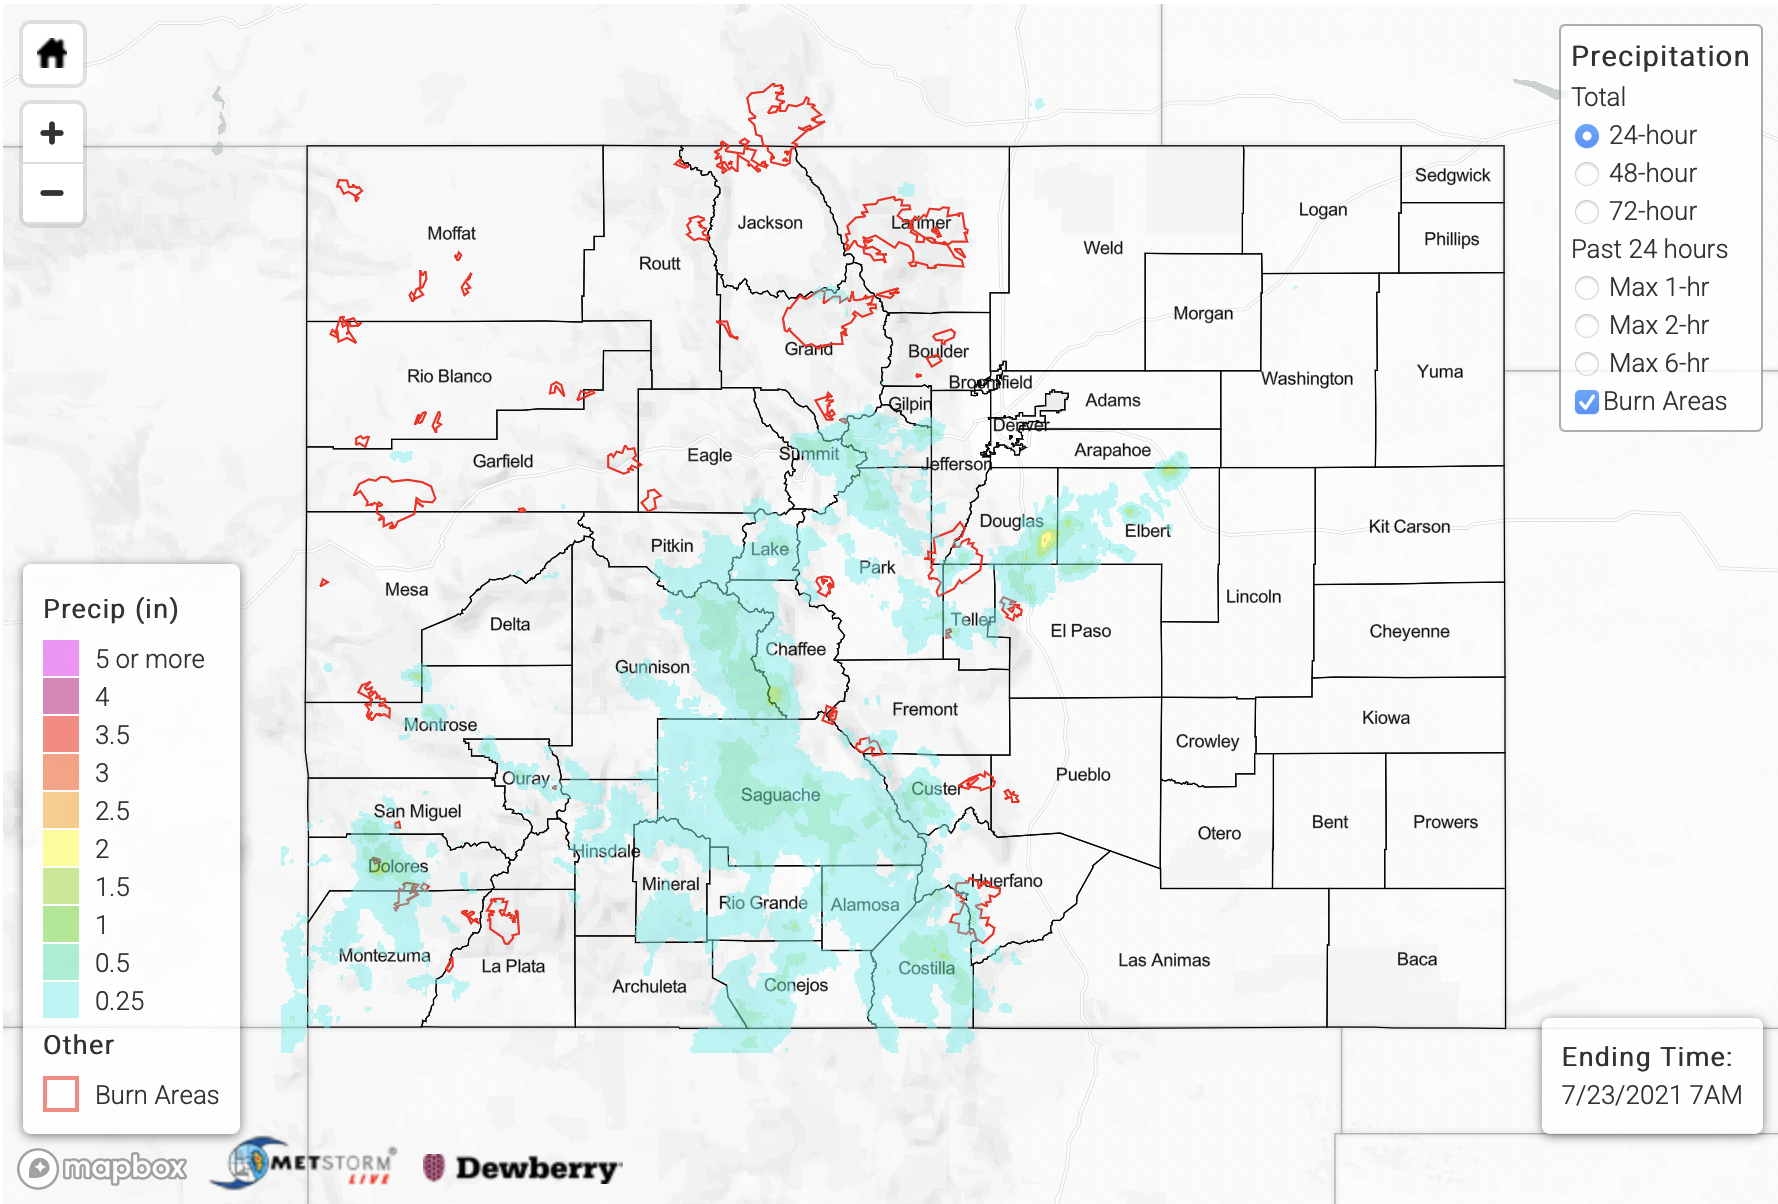
The map below shows radar-estimated, rainfall gage-adjusted Quantitative Precipitation Estimates (QPE) across Colorado. The map is updated daily during the operational season (May 1 – Sep 30) by 11AM. The following six layers are currently available: 24-hour, 48-hour and 72-hour total precipitation, as well as maximum 1-hour, 2-hour and 6-hour precipitation over the past 24 hour period (to estimate where flash flooding may have occurred). The 24-hour, 48-hour and 72-hour total precipitation contain bias corrections that are not disaggregated into the hourly estimates, so there will likely be some differences. The accumulation ending time is 7AM of the date shown in the bottom right corner. Also shown optionally are vulnerable fire burn areas (post 2012), which are updated throughout the season to include new, vulnerable burn areas. The home button in the top left corner resets the map to the original zoom.

SPM 07-21-2021: Deadly Burn Scar Flooding

Issue Date: Wednesday, July 21, 2021
Issue Time: 9:50 AM MDT

Summary:

Yesterday saw two very different setups between the eastern and western halves of the state, with the Continental Divide acting as a barrier between the plume of monsoonal moisture advecting into the state. There was widespread thunderstorm activity in the west, compared to hot and dry conditions to the east. The extra monsoonal moisture that flowed into Northern and Central Mountains helped to moderate fire behavior on the Morgan Creek, Sylvan, and Muddy Slide fires with higher humidity and chances for wetting rains from thunderstorms. However, heavy rains also resulted in floods in the Poudre Canyon, Glenwood Canyon, and near Telluride.

Flash flood warnings were issued for the Poudre Canyon after Doppler radar indicated heavy rainfall, and the canyon was evacuated yesterday evening. Up to 1 inch of rain fell in just half an hour over the Cameron Peak burn scar, resulting in rapid, deadly debris flow and runoff into the Cachle la Poudre River. Kylie Bearse shared the following video on twitter showing the fast-moving river – debris and ash from the burn scar cause the river to look black. Highway 14 remains closed from Rustic to Cameron Pass.

Widespread storms lingered in the Central Mountains late into the night. A flash flood warning for Glenwood Canyon was issued at 8:36 pm after Doppler radar indicated heavy rainfall over the Grizzly Creek burn scar, prompting a safety closure of I-70 through the canyon. Several debris flows ultimately made their way down the canyon, blocking the westbound lanes of I-70 and requiring cleanup – the interstate is still closed this morning. A CoCoRaHS observer in Glenwood Springs reported up to 0.40 inches of rain yesterday.

Heavy rains also produced flooding and debris flows in Telluride. A sheriff reported a tree and mud over Highway 145, and an additional debris flow crossing the road near Bridal Veil Falls. A CoCoRaHS observer in Placerville, west of Telluride, reported 0.72 inches yesterday and the following remark:

Rain began at 2:30 pm with .4 inch between then and 2:45. Another cloudburst around 4pm then rain and drizzle till 10pm.

For rainfall estimates in your area, check out the State Precipitation Map below.

Click Here For Map Overview
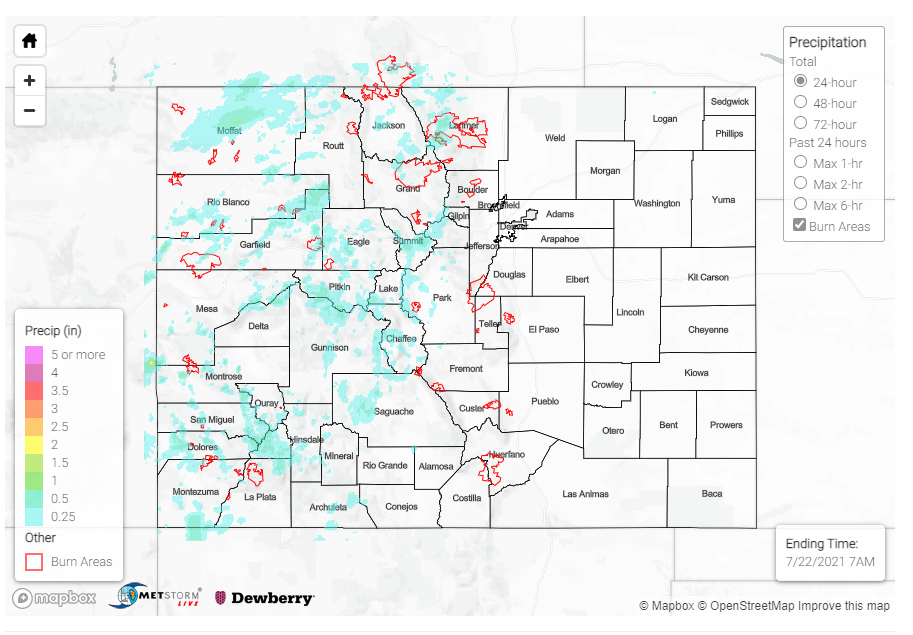
The map below shows radar-estimated, rainfall gage-adjusted Quantitative Precipitation Estimates (QPE) across Colorado. The map is updated daily during the operational season (May 1 – Sep 30) by 11AM. The following six layers are currently available: 24-hour, 48-hour and 72-hour total precipitation, as well as maximum 1-hour, 2-hour and 6-hour precipitation over the past 24 hour period (to estimate where flash flooding may have occurred). The 24-hour, 48-hour and 72-hour total precipitation contain bias corrections that are not disaggregated into the hourly estimates, so there will likely be some differences. The accumulation ending time is 7AM of the date shown in the bottom right corner. Also shown optionally are vulnerable fire burn areas (post 2012), which are updated throughout the season to include new, vulnerable burn areas. The home button in the top left corner resets the map to the original zoom.

Note: The 24-hour, 48-hour and 72-hour total precipitation do not contain bias corrections today due to errors in the CoCoRaHS data. This means there may be underestimations in QPE over the southwest and southeast corners of the state.

SPM 07-20-2021: Isolated Afternoon Showers in Western Colorado

Issue Date: Tuesday, July 20, 2021
Issue Time: 9:10 AM MDT

Summary:

Monday was hot and largely dry across much of Colorado thanks to an upper-level ridge moving eastward across the region. The hot and dry weather elevated fire weather conditions for both the Morgan Creek and Muddy slide fires in the Northern and Central Mountains. Smoke from these fires, as well as those in the surrounding western states, left smoke and haze in the air and reduced air quality.

Still, monsoonal moisture helped fuel isolated afternoon storms in the Northwest Slope, Grand Valley, and Southwest Slope. Afternoon showers in Dinosaur resulted in 0.32 inches of accumulation according to a CoCoRaHS observer. Cedaredge, in the Grand Valley, received 0.28 inches. Storms were more widespread in the Southwest Slope, but rainfall totals were more modest, Trace – 0.24 inch observations were scattered across Montezuma, La Plata, and Archuleta counties, which is just under the threshold to show up in the State Precipitation Map below. However, a US Climate Reference Network gauge at Mesa Verde recorded 0.48 inches in a single hour.

For rainfall estimates in your area, check out the State Precipitation Map below.

Click Here For Map Overview

The map below shows radar-estimated, rainfall gage-adjusted Quantitative Precipitation Estimates (QPE) across Colorado. The map is updated daily during the operational season (May 1 – Sep 30) by 11AM. The following six layers are currently available: 24-hour, 48-hour and 72-hour total precipitation, as well as maximum 1-hour, 2-hour and 6-hour precipitation over the past 24 hour period (to estimate where flash flooding may have occurred). The 24-hour, 48-hour and 72-hour total precipitation contain bias corrections that are not disaggregated into the hourly estimates, so there will likely be some differences. The accumulation ending time is 7AM of the date shown in the bottom right corner. Also shown optionally are vulnerable fire burn areas (post 2012), which are updated throughout the season to include new, vulnerable burn areas. The home button in the top left corner resets the map to the original zoom.

SPM 07-19-2021: Thunderstorms in Southern Corners of Colorado

Issue Date: Monday, July 19, 2021
Issue Time: 9:35 AM MDT

Summary:

A high-pressure ridge in western Colorado limited storm development across much of the state yesterday, with the exception of the Southwest Slope, San Juan Mountains, and Southeast Plains.

Severe thunderstorms developed on the Southeast Plains near the I-70 corridor and Kansas state line in the early afternoon. Several severe thunderstorm warnings were issued as storms moved along in a general north to south motion – the largest severe threats being high winds and large, damaging hail, but the potential for heavy rain remained as well. These storms were also very slow moving, and many warning messages mentioned the cells as “nearly stationary.” Several large hail reports came in, ranging from 0.25-1.00 inches, and wind gusts up to 56 mph. Due to the rural location of these storms, there are limited observations, but some notable storm totals from CoCoRaHS observers include:

  • 1.02 inches in Holly
  • 0.64 inches in Cheyenne Wells
  • 0.33 inches in Springfield

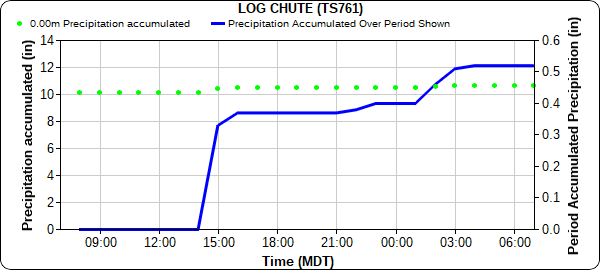
On the other side of the state, two pulses of thunderstorm activity fueled by monsoonal moisture brought moderate precipitation to the Southwest Slope and San Juan Mountains. The first round of thunderstorms began in the afternoon with a break in activity until late evening/overnight. Mancos and Durango each picked up around 0.45 inches, according to CoCoRaHS observers. The time series plot from Log Chute, north of Durango, shows the two periods of storm activity, with the first pulse observed at this location around 3:00 pm and then second after midnight.

Pagosa Springs received between 0.25-0.80 inches of precipitation as well. The gridded MetStorm Live precipitation totals, as seen in the State Precipitation Map below, have underestimated precipitation in southern San Juan Mountains yesterday. This is possibly because storm tops were fairly low and the far-away radars in Grand Junction and Albuquerque were scanning too high to accurately pick up rainfall intensity. For rainfall estimates in your area, including antecedent conditions, check out the SPM below!

Click Here For Map Overview

The map below shows radar-estimated, rainfall gage-adjusted Quantitative Precipitation Estimates (QPE) across Colorado. The map is updated daily during the operational season (May 1 – Sep 30) by 11AM. The following six layers are currently available: 24-hour, 48-hour and 72-hour total precipitation, as well as maximum 1-hour, 2-hour and 6-hour precipitation over the past 24 hour period (to estimate where flash flooding may have occurred). The 24-hour, 48-hour and 72-hour total precipitation contain bias corrections that are not disaggregated into the hourly estimates, so there will likely be some differences. The accumulation ending time is 7AM of the date shown in the bottom right corner. Also shown optionally are vulnerable fire burn areas (post 2012), which are updated throughout the season to include new, vulnerable burn areas. The home button in the top left corner resets the map to the original zoom.